This page requires that JavaScript be enabled in your browser.
Learn how »
Mathematica Graphics for Presenting Multidimensional Evidence
Robert Yerex
Robert Yerex, chief economist at Kronos and creator of the Retail Labor Index, explained how he uses Mathematica to develop effective multidimensional infographics about trends in employment and retail sales at the Wolfram Technology Conference 2010.
Thanks for your feedback.
Channels: Technology Conference
1311 videos match your search.
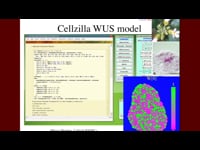 |
Eric Mjolsness Collaborative projects have resulted in several Mathematica-implemented modeling languages aimed at general-purpose biological modeling, which is a useful and topical but an indefinitely expandable goal. We update previous work on ... |
 |
Jae Bum Jung/Yan Zhuang |
 |
Phillip Todd |
 |
Василий Сороко |
 |
Phil Ramsden |
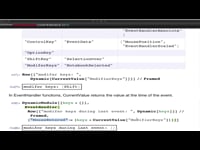 |
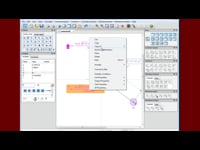
Lou D'Andria Constructing interfaces with Dynamic, DynamicModule and Manipulate is nothing new, but those aren't the only Dynamic primitives available in Mathematica. In this talk, we'll identify and demonstrate some of the ... |
 |
Галина Михалкина, Григорий Фридман |
 |
Галина Михалкина |
 |
Андрей Кротких |
 |
Антон Екименко, Кирилл Белов |
 |
Физический институт имени П.Н. Лебедева |
 |
Григорий Фридман, Олег Иванов |
 |
Галина Михалкина |
 |
Олег Кофнов |
 |
Николай Сосновский |
 |
Микаэл Эгибян |
 |
Микаэл Эгибян |
 |
Леонид Шифрин |
 |
Вахагн Геворгян |
 |
Алексей Семенов |
