This page requires that JavaScript be enabled in your browser.
Learn how »
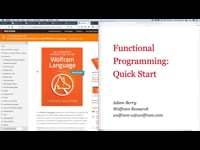
Data Visualization Quick Start
Brett Champion
Harness the power of Mathematica to interactively visualize your data. This presentation features a series of examples that show how to create a rich interface for exploring data in depth.
Thanks for your feedback.
Channels: Virtual Events
701 videos match your search.
 |
|
 |
Learn about access to external data from the Wolfram Language. Presentation topics include new built-in support for Wikidata, the Wolfram framework for relational database connectivity and the latest developments for ... |
 |
|
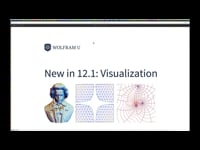 |
Brett Champion, Visualization Manager, and MinHsuan Peng, Visualization Developer, cover general improvements to visualization in Version 12.1, new vector plots and recent additions to visualization for complex valued functions and fields. |
 |
|
 |
|
 |
|
 |
|
 |
|
 |
|
 |
|
 |
|
 |
|
 |
|
 |
|
 |
Abrita Chakravarty |
 |
|
 |
Abrita Chakravarty |
 |
|
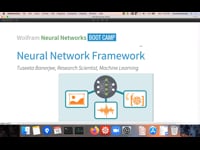 |
Tuseeta Banerjee |
