This page requires that JavaScript be enabled in your browser.
Learn how »
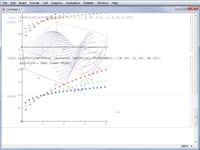
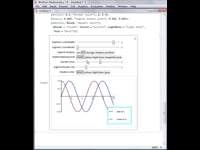
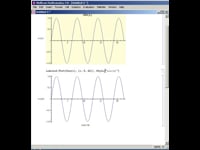
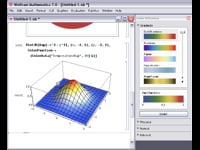
How to Label a Plot
Chris Carlson
Mathematica provides flexible options for labeling plots, allowing you to present ideas more clearly in presentations and publications. Learn more in this "How to" screencast.
Thanks for your feedback.
Channels: Graphics-Options-and-Styling-Videos
5 videos match your search.
 |
Mathematica gives you control over the behavior of most functions by providing options that you can customize. Learn more about finding available options for functions in this "How to" screencast. |
 |
Nick Gaskill In addition to letting you change the size of points in a 2D plot, Mathematica also lets you change the color and type of marker for points. Learn how in ... |
 |
Nick Gaskill Mathematica provides many options for customizing and annotating plots. Legends can be added to plots and customized with many of the same methods used to customize other Mathematica graphics. Learn ... |
 |
Chris Carlson Mathematica provides flexible options for labeling plots, allowing you to present ideas more clearly in presentations and publications. Learn more in this "How to" screencast. |
 |
Faisal Whelpley As well as being able to specify colors in several color spaces, Mathematica also contains a variety of predefined colors and aesthetically pleasing color spectrums. Learn more in this "How ... |
