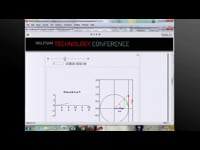
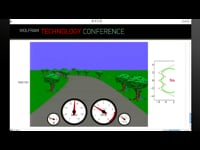
Gauges and Dashboards
Brett Champion
Highly customizable interactive gauges are part of Mathematica's collection of built-in visualizations. In this talk from the Wolfram Technology Conference, Brett Champion explains how the gauges work and shows use cases in dashboards, reports, and more.
Thanks for your feedback.