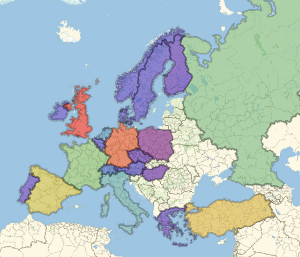
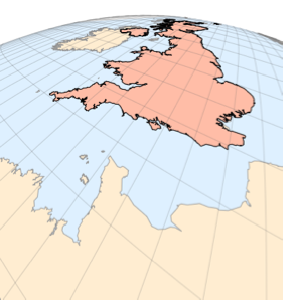
Country Borders
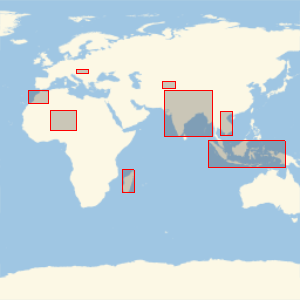
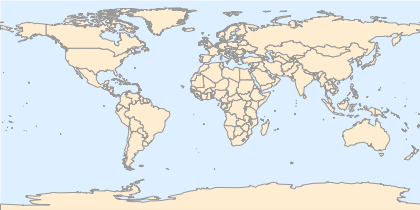
Use the new outline map style "CountryBorders".
In[1]:=
GeoGraphics["World", GeoBackground -> "CountryBorders"]Out[1]=
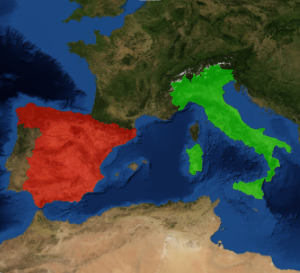
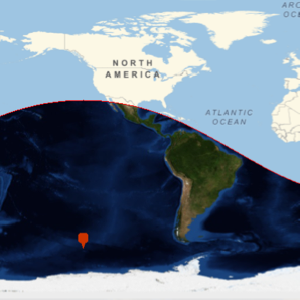
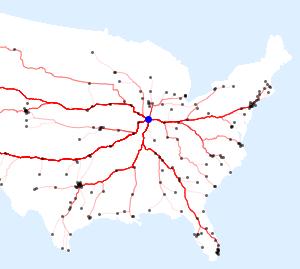
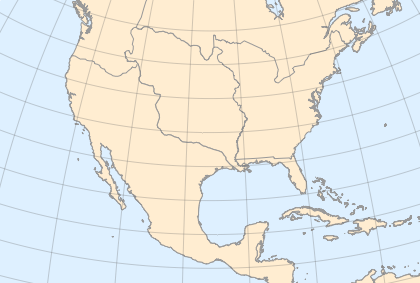
The country borders can also be given at other times. This is part of North America in 1803, just before the Louisiana Purchase.
In[2]:=
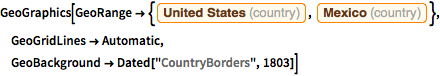
GeoGraphics[
 GeoRange -> {Entity["Country", "UnitedStates"],
   Entity["Country", "Mexico"]}, GeoGridLines -> Automatic,
 GeoBackground -> Dated["CountryBorders", 1803]]
Out[2]=
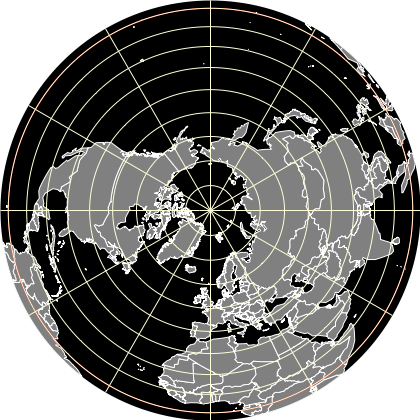
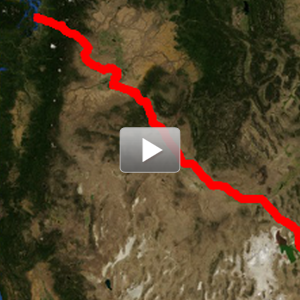
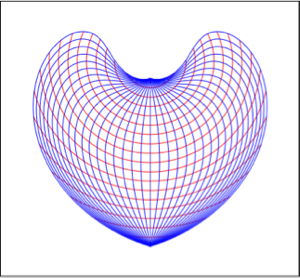
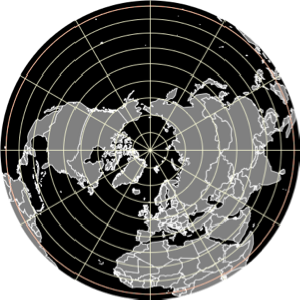
The "CountryBorders" map style can be combined with other GeoGraphics elements, and its basic directives can be modified.
In[3]:=
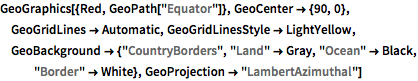
GeoGraphics[{Red, GeoPath["Equator"]}, GeoCenter -> {90, 0},
 GeoGridLines -> Automatic, GeoGridLinesStyle -> LightYellow,
 GeoBackground -> {"CountryBorders", "Land" -> Gray, "Ocean" -> Black,
    "Border" -> White}, GeoProjection -> "LambertAzimuthal"]
Out[3]=