Sample Points from Regions
RandomPoint samples a pseudorandom point set uniformly in a given region.
In[1]:=
Graphics[{Polygon[CirclePoints[5]], White,
  Point[RandomPoint[Polygon[CirclePoints[5]], 200]]},
 ImageSize -> Medium]
Out[1]=
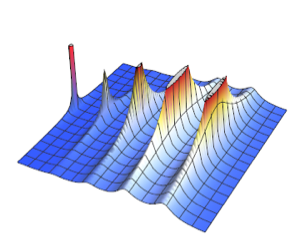
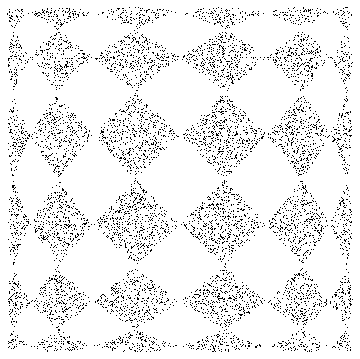
Sample points in an implicit Lissajous region.
In[2]:=
\[ScriptCapitalR] =
  ImplicitRegion[-1 + (-1 + 18 x^2 - 48 x^4 + 32 x^6)^2 + (-1 +
       18 y^2 - 48 y^4 + 32 y^6)^2 <= 0, {x, y}];
In[3]:=
Graphics[{PointSize[Tiny],
  Point[RandomPoint[\[ScriptCapitalR], 10^4]]}, ImageSize -> Medium]
Out[3]=
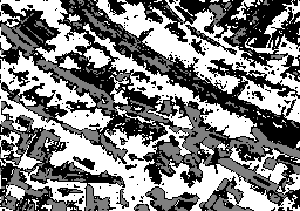
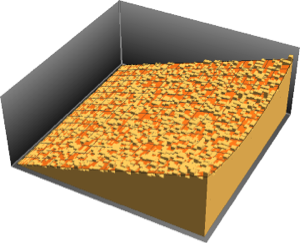
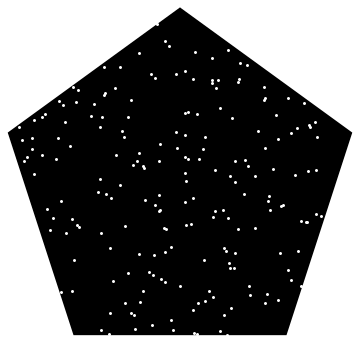
Sample points from a Text primitive.
In[4]:=
mr = DiscretizeGraphics[Text[Style["\[CapitalSigma]", Bold]], _Text,
   MaxCellMeasure -> 0.1];
In[5]:=
Graphics[{PointSize[Tiny], Point[RandomPoint[mr, 10000]]},
 ImageSize -> Medium]
Out[5]=

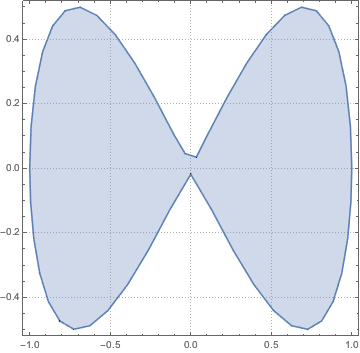
Use the Monte Carlo method to approximate an integral with a domain in a parametric region.
In[6]:=
region = ParametricRegion[{{s, s t}, s^2 + t^2 <= 1}, {s, t}];show complete Wolfram Language input
Out[7]=
The function to be integrated over the domain.
In[8]:=
f[{x_, y_}] := x^3 - 2 x^2 y + 4 x^6 - y^5;
val = NIntegrate[f[{x, y}], {x, y} \[Element] region]
Out[8]=
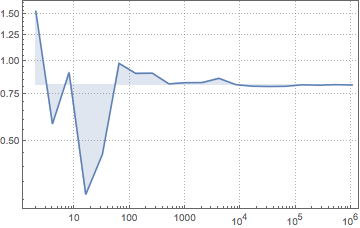
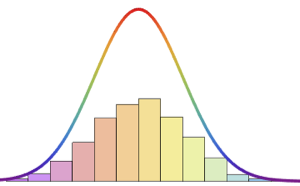
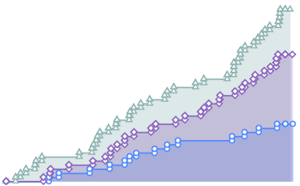
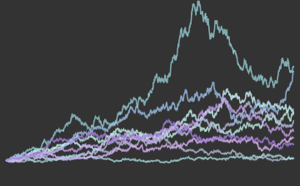
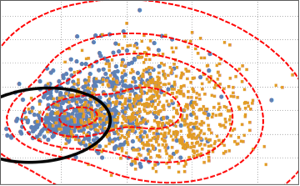
Visualize the convergence of the Monte Carlo statistic as the sample size increases.
show complete Wolfram Language input
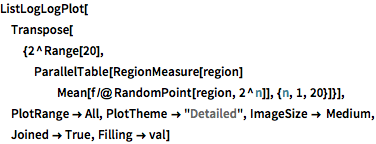
Out[9]=