Social Networks Modeling
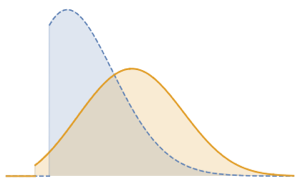
The shifted Gompertz distribution is the distribution of the maximum of independent exponential and extreme-value distributed random variables. The distribution can be used to model the growth and decline of interest in social networks. The CDF of the shifted Gompertz distribution takes the following form.
In[1]:=
CDF[ShiftedGompertzDistribution[\[Lambda], \[Xi]], x]Out[1]=
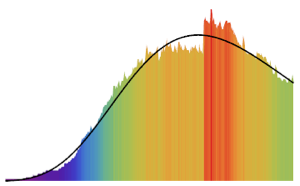
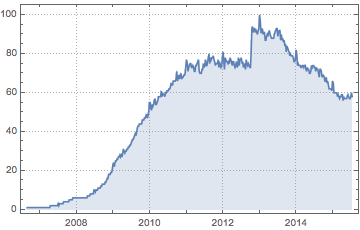
Weekly counts for interest on Facebook from Google Trends.
In[2]:=
ts = TemporalData[TimeSeries, {CompressedData["
1:eJyFz2tPwjAUBmDA+7wRNCpeQBTRiAGvXLoNYYytPW03QHSybiYav/tX/Ume
GRO/mPg0p+l72pykpbeP8VsmlUqlsT5xS/8n82smM/Nt9sdcYv4vC2gxoWlL
mqYto5WVVbS2tp7N5nK5jY3N7Z2tnXx+d3dvbx/XQbFwUCgUi4eHpdLRcbl8
UjmtnJ1XqxeoVqvV65dX9cvrZvP2pnHXaLUbjWaLIJMYuk4MwzTNTue+1+1a
qO9a9qA/cPq2PRg4ILnLgHPGgLkuABfSdRyHUs5AAghvyD3peb4U+IhLJoCB
NxLUk0JwgXcCRNIT2AYpPS4YByo5cGBsFL+oOFaRCqP4/VWpOFQqCKbhVEXh
9BmFKopjTFEQBs9PweRxNHkYj/yh7/ueEHI8xDGAg7AAqMsodRw3OTP2HWxK
XfyFbVl2z+p2kGn1jATRSZsQXW+RNkpSmxjkC/7xXxc=
"], {
TemporalData`DateSpecification[{2006, 8, 26, 0, 0, 0.}, {
      2015, 7, 11, 0, 0, 0.}, {1, "Week"}]}, 1, {"Continuous", 1}, {
    "Discrete", 1}, 1, {
    ValueDimensions -> 1, DateFunction -> Automatic,
     ResamplingMethod -> {"Interpolation", InterpolationOrder -> 1}}},
    True, 314.1];
show complete Wolfram Language input
Out[3]=
Fitting the data to a truncated shifted Gompertz distribution.
In[4]:=
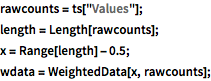
rawcounts = ts["Values"];
length = Length[rawcounts];
x = Range[length] - 0.5;
wdata = WeightedData[x, rawcounts];
In[5]:=
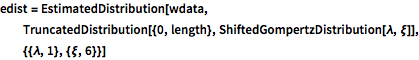
edist = EstimatedDistribution[wdata,
  TruncatedDistribution[{0, length},
   ShiftedGompertzDistribution[\[Lambda], \[Xi]]], {{\[Lambda],
    1}, {\[Xi], 6}}]
Out[5]=
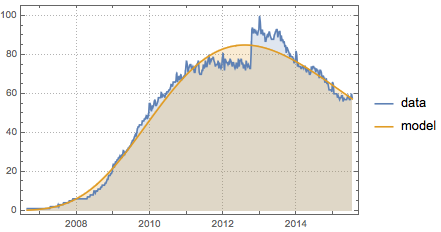
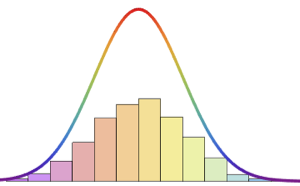
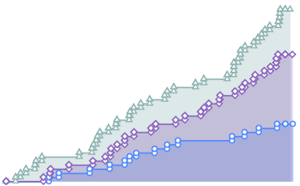
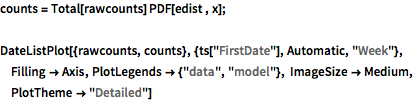
Compare the predictions from the model to the data.
show complete Wolfram Language input
Out[6]=