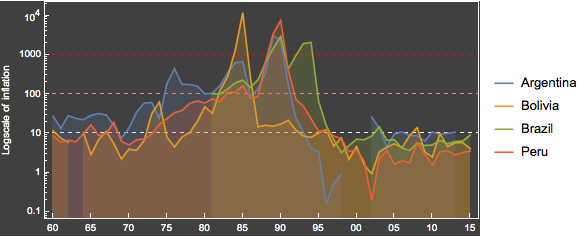
Analyze Hyperinflation Rates of South American Countries
Connect to the Federal Reserve Economic Data API.
In[1]:=
fred = ServiceConnect["FederalReserveEconomicData"]Out[1]=
Get a list of South American countries.
In[2]:=
countries = CountryData["SouthAmerica"];Retrieve inflation time series from the chosen countries.
In[3]:=
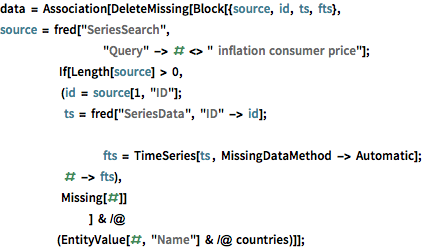
data = Association[DeleteMissing[Block[{source, id, ts, fts},
       source =
        fred["SeriesSearch",
         "Query" -> # <> "  inflation consumer price"];
              	If[Length[source] > 0,
                	(id = source[1, "ID"];
                  	ts = fred["SeriesData", "ID" -> id];

         fts = TimeSeries[ts , MissingDataMethod -> Automatic];
                  	# -> fts),
                	Missing[#]]
       		] & /@ (EntityValue[#, "Name"] & /@ countries)]];
Make a plot of countries with hyperinflation in the 1960–2015 period.
show complete Wolfram Language input
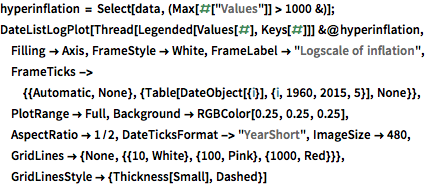
Out[4]=