Nonparametric Distributions of Quantity Data
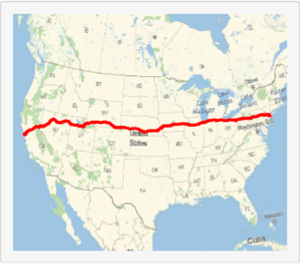
Use WeatherData to get time series of the wind speed measurements in the city of Chicago from the beginning of 2014 through the end of 2015.
In[1]:=
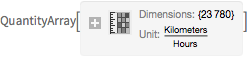
wsts = WeatherData["Chicago",
  "WindSpeed", {DateObject[{2014, 1, 1}], DateObject[{2015, 12, 31}]}]
Out[1]=
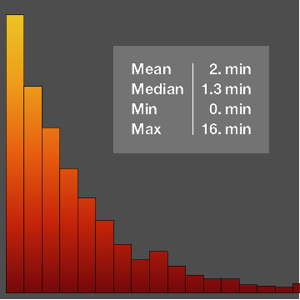
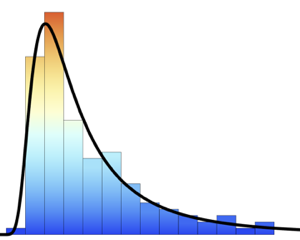
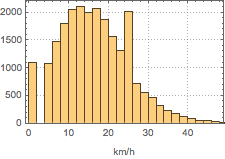
Use Histogram to visualize the distribution of wind speeds.
In[2]:=
Histogram[wsts, PlotTheme -> "Detailed", FrameLabel -> Automatic]Out[2]=
Extract wind speed values with the missing values interpolated.
In[3]:=
winds = Values[TimeSeries[wsts, MissingDataMethod -> "Interpolation"]]Out[3]=
Use SmoothKernelDistribution to construct a nonparametric model of wind speeds in Chicago, making sure that wind speed stays non-negative.
In[4]:=
ws\[ScriptCapitalD] =
 SmoothKernelDistribution[winds,
  Automatic, {"Bounded", Quantity[0, ("Kilometers")/("Hours")],
   "Gaussian"}]
Out[4]=
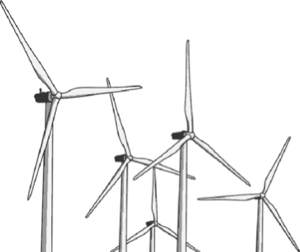
Use a nonparametric model of the turbine's power output as a function of wind speed to estimate the average power output for a GE 1.5 MW wind turbine installed at the location.
In[5]:=
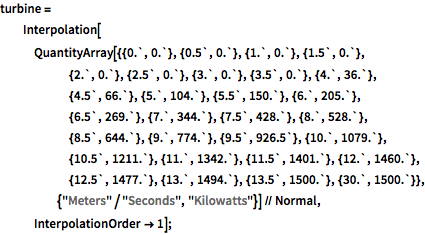
turbine =
  Interpolation[
   QuantityArray[{{0.`, 0.`}, {0.5`, 0.`}, {1.`, 0.`}, {1.5`,
       0.`}, {2.`, 0.`}, {2.5`, 0.`}, {3.`, 0.`}, {3.5`, 0.`}, {4.`,
       36.`}, {4.5`, 66.`}, {5.`, 104.`}, {5.5`, 150.`}, {6.`,
       205.`}, {6.5`, 269.`}, {7.`, 344.`}, {7.5`, 428.`}, {8.`,
       528.`}, {8.5`, 644.`}, {9.`, 774.`}, {9.5`, 926.5`}, {10.`,
       1079.`}, {10.5`, 1211.`}, {11.`, 1342.`}, {11.5`,
       1401.`}, {12.`, 1460.`}, {12.5`, 1477.`}, {13.`,
       1494.`}, {13.5`, 1500.`}, {30.`, 1500.`}}, {"Meters"/"Seconds",
       "Kilowatts"}] // Normal, InterpolationOrder -> 1];
In[6]:=
NExpectation[turbine[v], v \[Distributed] ws\[ScriptCapitalD]]Out[6]=