自动标注数据
ListPlot 及相关函数现在可支持 LabelingFunction.
显示完整的 Wolfram 语言输入
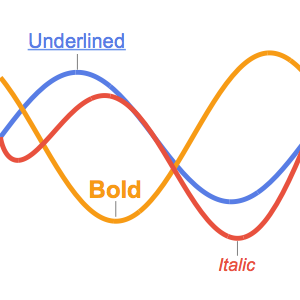
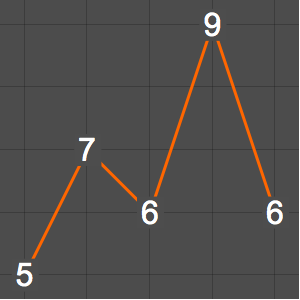
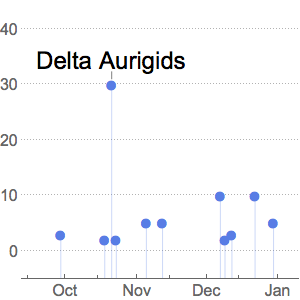
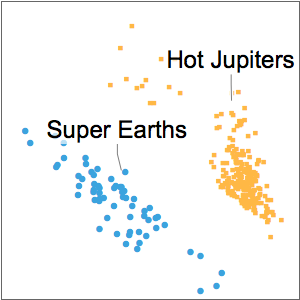
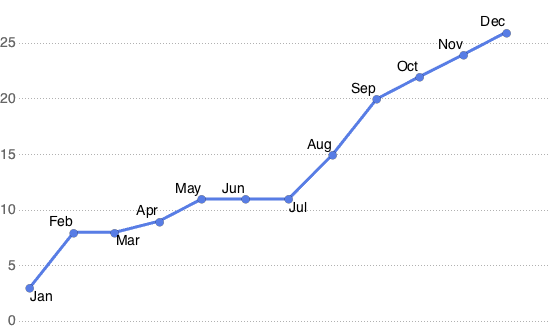
当出现合适的元数据时,LabelingFunction 自动将其作为标签使用.
In[2]:=
months = {"Jan", "Feb", "Mar", "Apr", "May", "Jun", "Jul", "Aug",
   "Sep", "Oct", "Nov", "Dec"};
In[3]:=
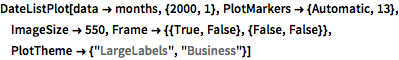
DateListPlot[data -> months, {2000, 1},
 PlotMarkers -> {Automatic, 13}, ImageSize -> 550,
 Frame -> {{True, False}, {False, False}},
 PlotTheme -> {"LargeLabels", "Business"}]
Out[3]=
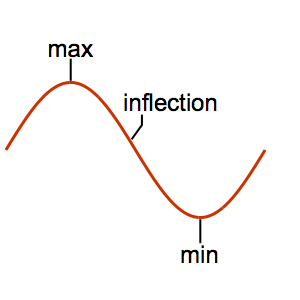
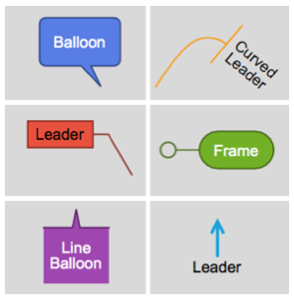
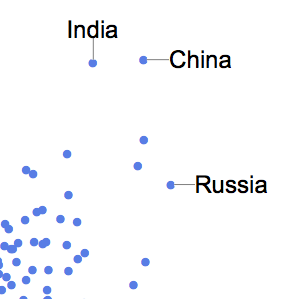
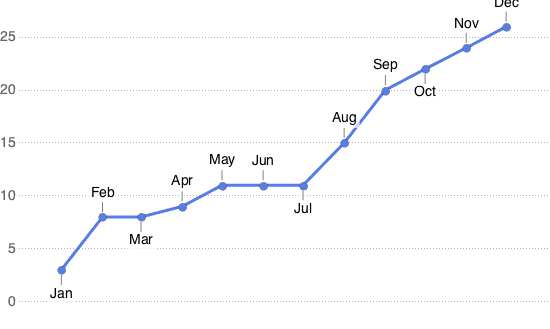
在 LabelingFunction 中使用 Callout.
In[4]:=
DateListPlot[data -> months, {2000, 1},
 LabelingFunction -> Callout[ Automatic, Automatic], opts]
Out[4]=
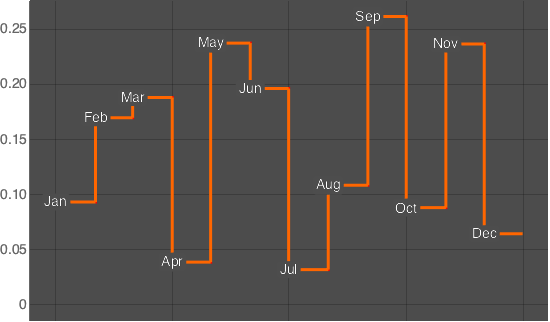
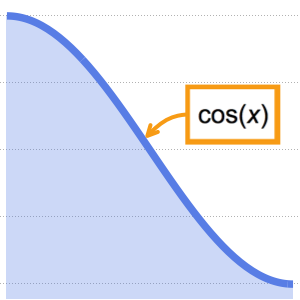
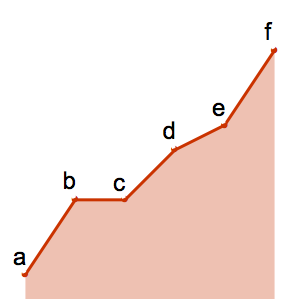
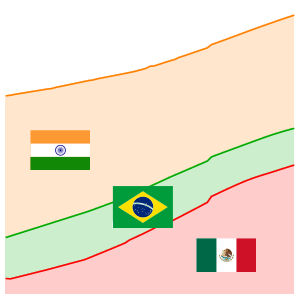
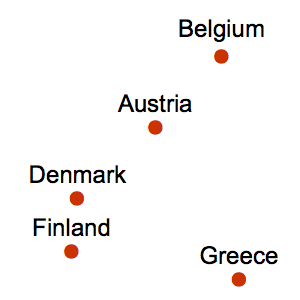
将标签放在数据的中心.
In[5]:=
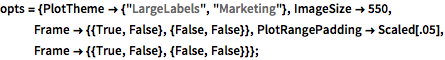
opts = {PlotTheme -> {"LargeLabels", "Marketing"}, ImageSize -> 550,
   Frame -> {{True, False}, {False, False}},
   PlotRangePadding -> Scaled[.05],
   Frame -> {{True, False}, {False, False}}};
In[6]:=
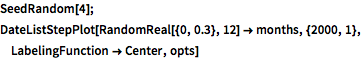
SeedRandom[4]; DateListStepPlot[
 RandomReal[{0, 0.3}, 12] -> months, {2000, 1},
 LabelingFunction -> Center, opts]
Out[6]=