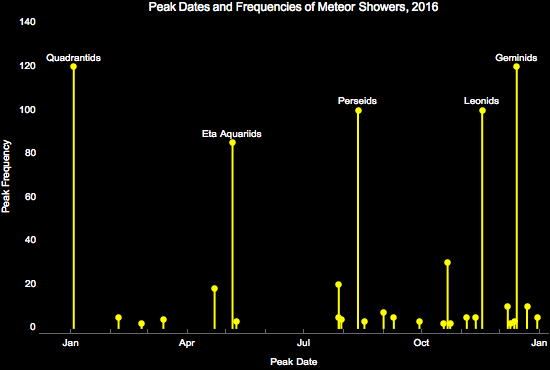
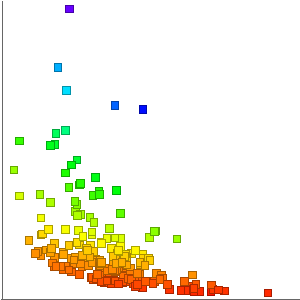
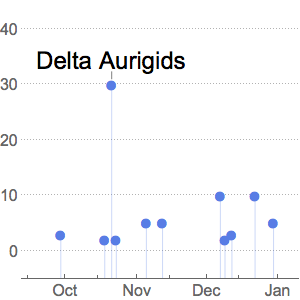
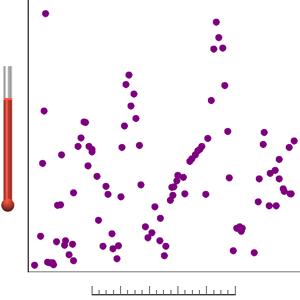
Meteor Shower Data
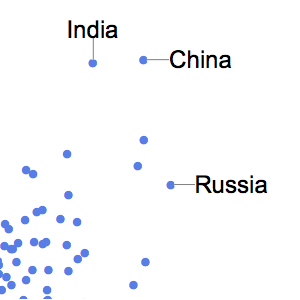
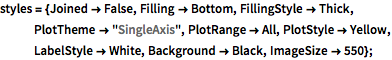
Combine LabelingFunction and Callout to label only data meeting certain conditions.
show complete Wolfram Language input
In[2]:=
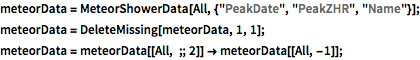
meteorData = MeteorShowerData[All, {"PeakDate", "PeakZHR", "Name"}];
meteorData = DeleteMissing[meteorData, 1, 1];
meteorData = meteorData[[All, ;; 2]] -> meteorData[[All, -1]];
In[3]:=
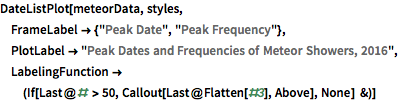
DateListPlot[meteorData, styles,
 FrameLabel -> {"Peak Date", "Peak Frequency"},
 PlotLabel -> "Peak Dates and Frequencies of Meteor Showers, 2016",
 LabelingFunction -> (If[Last@# > 50,
     Callout[Last@Flatten[#3], Above], None] &)]
Out[3]=