Built-In Volumes
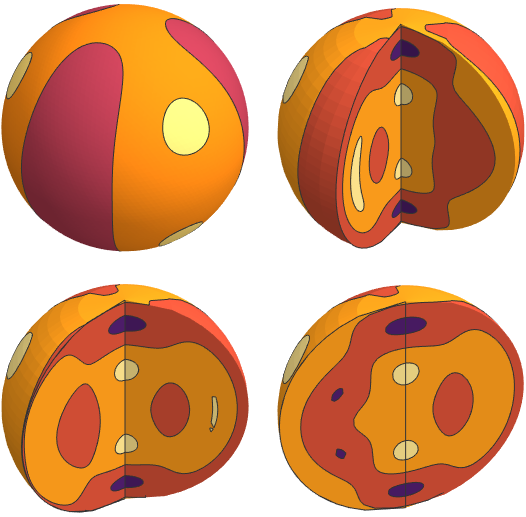
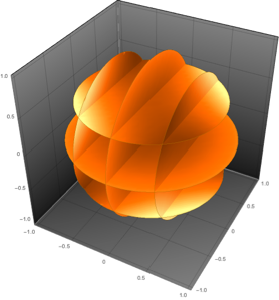
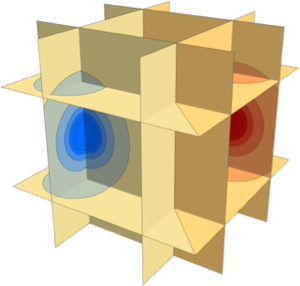
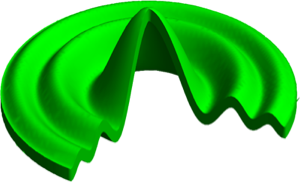
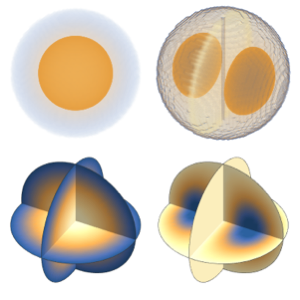
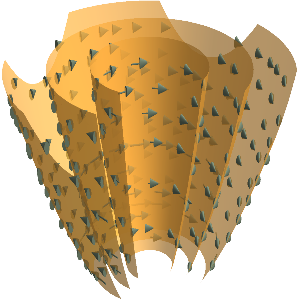
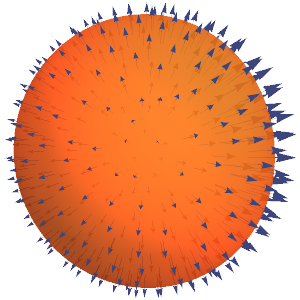
Use spheres with sectors of varying size removed as the surface slices for a contour plot.
show complete Wolfram Language input
In[2]:=
func = Simplify[
   Sum[Cos[5 Norm[{x, y, z} - {Sin[\[Theta]], Cos[\[Theta]],
         0}]], {\[Theta], 0., 2 \[Pi] - (2 \[Pi])/3, (2 \[Pi])/
     3}], (x | y | z) \[Element] Reals];
In[3]:=
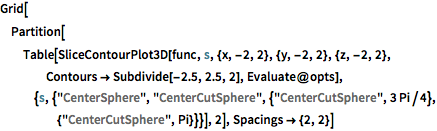
Grid[Partition[
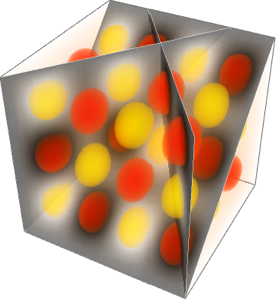
Table[SliceContourPlot3D[func,
s, {x, -2, 2}, {y, -2, 2}, {z, -2, 2},
Contours -> Subdivide[-2.5, 2.5, 2],
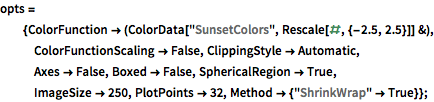
Evaluate@opts], {s, {"CenterSphere",
"CenterCutSphere", {"CenterCutSphere",
3 Pi/4}, {"CenterCutSphere", Pi}}}], 2], Spacings -> {2, 2}]Out[3]=