Visualize Nutrition in the Periodic Table of Elements
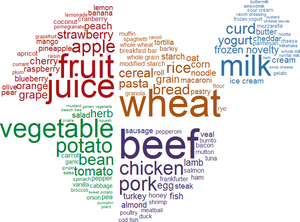
The periodic table of the elements created by Dmitri Mendeleev has been in use for 150 years. To celebrate the sesquicentennial of this valuable chemistry tool, use the Wolfram Language to visualize and compare the nutrition content of foods on the periodic table.
Start with a blueprint of the modern periodic table of elements.
Check the blueprint's contents by creating a simple graphics expression.
Create a more complex visualization of elements and amounts, akin to GeoRegionValuePlot.
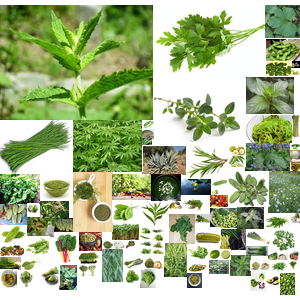
Find the elemental composition for nutrition properties by extracting nutrient names, aligning them to chemical entities with Interpreter and finally, using the "AtomList" property of Molecule expressions.
Create a function to gather the elemental composition of a food using the elemental composition data.
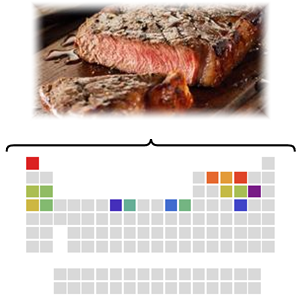
Now visualize the elemental composition on the periodic table.
Repeat for a different food.
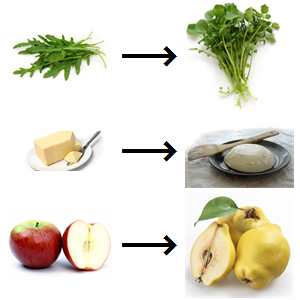
Compute the relative differences in elemental composition for the foods.
Show the relative differences on the periodic table.
Compare chicken liver and chicken breast by looking at differences in trace elements.
Compare apples and oranges.