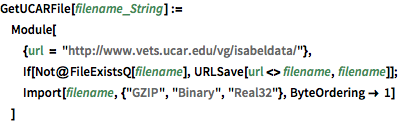
Analyzing and Rendering Simulation Data
Visualizing and analyzing the simulation results of hurricane Isabel from the National Center for Atmospheric Research (NCAR).
Hurricane Isabel data produced by the Weather Research and Forecast (WRF) model, courtesy of NCAR, and the US National Science Foundation (NSF).
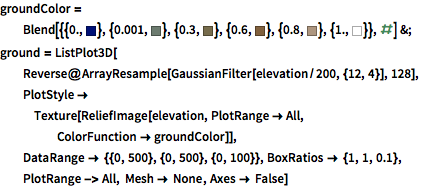
Import and visualize the elevation data using an appropriate color function.
show complete Wolfram Language inputhide input
| Out[4]= | 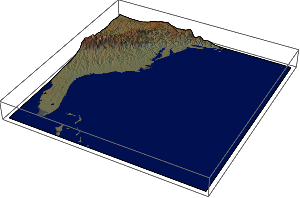 |
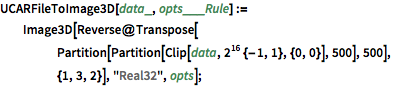
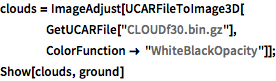
Import the volumetric cloud data at time step  and superimpose it on the elevation map. The download may take a while.
| Out[5]= | 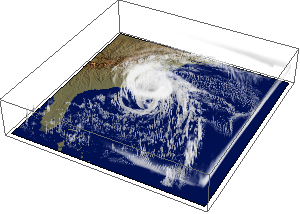 |
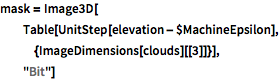
Create a mask for the airspace over land.
| Out[6]= | 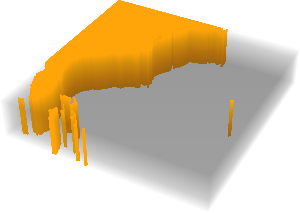 |
Measure the cloud (water[kg]/air[kg]) cover over land and over sea.
| Out[7]= | 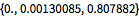 |
| Out[8]= | 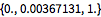 |
| Out[9]//TraditionalForm= |
| | 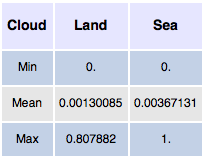 |
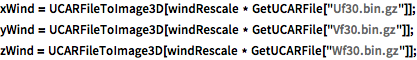
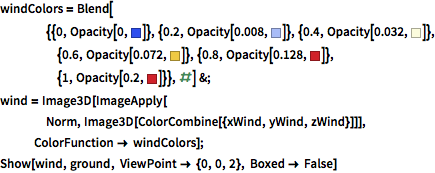
Import wind velocities in x, y, and z direction to determine and display wind magnitude.
show complete Wolfram Language inputhide input
| Out[11]= | 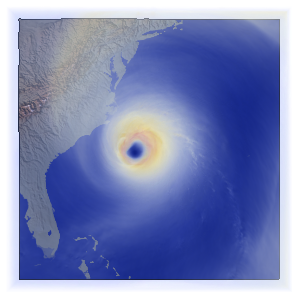 |
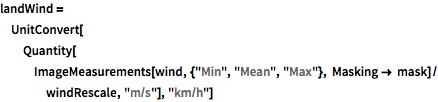
Measure wind magnitude over land and over sea.
| Out[12]= |  |
| Out[13]= |  |
| Out[14]//TraditionalForm= |
| | 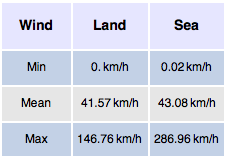 |