Enhanced Visualization
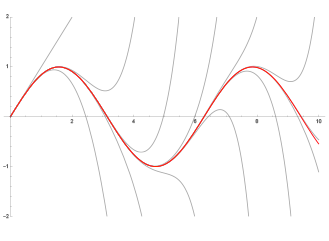
Version 10 refreshes the overall aesthetic for visualizations, combining a bolder, unified color scheme across all visualization functions, with new automatic computation of visual attributes such as point sizes, edge styles, surface colors, and axes positioning. Besides the default appearance, a whole set of themes easily and automatically changes how plots look for a variety of situations and uses. The visualization functions are also extended to automatically work on time series, associated arrays, and data with units.
- New color scheme that unifies all the visualization functions.
- Plot themes easily change the appearance and focus of graphics.
- Automatic selection of point sizes depending on the size and distribution of datasets.
- Unique plot styles for surfaces.
- Better contrasting colors for people with color vision deficiencies.
- Filling styles automatically follow the main plot style.
- Edges in bar charts in histograms automatically fade out as the density increases.
- Faster rendering of large and complex point sets.
- Automatic legend construction has been added for vector and stream plots, as well as other specialized visualizations.
- Plot data directly from associative arrays, automatically using the keys as legend labels.
- Plot time and event series directly.
- Use data with associated weights in statistical plots.
- Plotting data or functions with units automatically detects and converts the units.
- Plot values, ranges, and inequalities on number lines.
- Visualize Mandelbrot and Julia sets.
- Plot locations on maps using a variety of explicit or implicit forms.
- Color map regions according to associated values.
Related Examples
 New Default Styles »
 Improved Styles for Color Vision Impairment »
 Use Plot Themes to Customize Plots »
 Adaptive Point Size Selection »
 Plot Functions Using Units »
 Units Improvement »
 Units for Legends »
 Use Weighted Data Instead of a Full Dataset »
 Plot Time and Event Series »
 Plot Keys and Values from Associations »
 Plot Values from Associations »
 Use Combinations of Wrappers »
Related FunctionsPlotTheme  TimeSeries EventSeries Quantity Association WeightedData ArrayPlot BodePlot ChromaticityPlot CommunityGraphPlot ContourPlot DateListLogPlot DateListPlot DensityPlot DiscretePlot GeoListPlot GeoRegionValuePlot GraphPlot JuliaSetPlot LayeredGraphPlot LineIntegralConvolutionPlot ListContourPlot ListCurvePathPlot ListDensityPlot ListLineIntegralConvolutionPlot ListLinePlot ListLogLinearPlot ListLogLogPlot ListLogPlot ListPlot ListPolarPlot ListStreamDensityPlot ListStreamPlot ListVectorDensityPlot ListVectorPlot LogLinearPlot LogLogPlot LogPlot MandelbrotSetPlot MatrixPlot NicholsPlot NumberLinePlot NyquistPlot ParametricPlot Plot PolarPlot ProbabilityPlot ProbabilityScalePlot QuantilePlot RegionPlot ReliefPlot RootLocusPlot SingularValuePlot StreamDensityPlot StreamPlot TreePlot VectorDensityPlot VectorPlot WaveletImagePlot WaveletListPlot WaveletMatrixPlot ChromaticityPlot3D ContourPlot3D DiscretePlot3D GraphPlot3D ListContourPlot3D ListPlot3D ListPointPlot3D ListSurfacePlot3D ListVectorPlot3D ParametricPlot3D Plot3D RegionPlot3D RevolutionPlot3D SphericalPlot3D VectorPlot3D BarChart BoxWhiskerChart BubbleChart CandlestickChart DistributionChart InteractiveTradingChart KagiChart LineBreakChart PairedBarChart PieChart PointFigureChart RectangleChart RenkoChart SectorChart TradingChart BarChart3D BubbleChart3D PieChart3D RectangleChart3D SectorChart3D DensityHistogram Histogram ImageHistogram PairedHistogram PairedSmoothHistogram SmoothDensityHistogram SmoothHistogram Histogram3D SmoothHistogram3D
TimeSeries EventSeries Quantity Association WeightedData ArrayPlot BodePlot ChromaticityPlot CommunityGraphPlot ContourPlot DateListLogPlot DateListPlot DensityPlot DiscretePlot GeoListPlot GeoRegionValuePlot GraphPlot JuliaSetPlot LayeredGraphPlot LineIntegralConvolutionPlot ListContourPlot ListCurvePathPlot ListDensityPlot ListLineIntegralConvolutionPlot ListLinePlot ListLogLinearPlot ListLogLogPlot ListLogPlot ListPlot ListPolarPlot ListStreamDensityPlot ListStreamPlot ListVectorDensityPlot ListVectorPlot LogLinearPlot LogLogPlot LogPlot MandelbrotSetPlot MatrixPlot NicholsPlot NumberLinePlot NyquistPlot ParametricPlot Plot PolarPlot ProbabilityPlot ProbabilityScalePlot QuantilePlot RegionPlot ReliefPlot RootLocusPlot SingularValuePlot StreamDensityPlot StreamPlot TreePlot VectorDensityPlot VectorPlot WaveletImagePlot WaveletListPlot WaveletMatrixPlot ChromaticityPlot3D ContourPlot3D DiscretePlot3D GraphPlot3D ListContourPlot3D ListPlot3D ListPointPlot3D ListSurfacePlot3D ListVectorPlot3D ParametricPlot3D Plot3D RegionPlot3D RevolutionPlot3D SphericalPlot3D VectorPlot3D BarChart BoxWhiskerChart BubbleChart CandlestickChart DistributionChart InteractiveTradingChart KagiChart LineBreakChart PairedBarChart PieChart PointFigureChart RectangleChart RenkoChart SectorChart TradingChart BarChart3D BubbleChart3D PieChart3D RectangleChart3D SectorChart3D DensityHistogram Histogram ImageHistogram PairedHistogram PairedSmoothHistogram SmoothDensityHistogram SmoothHistogram Histogram3D SmoothHistogram3DRelated Guides


