Wolfram
Mathematica
8의 신기능: 금융 시각화
◄
이전
|
다음
►
그래픽 및 시각화
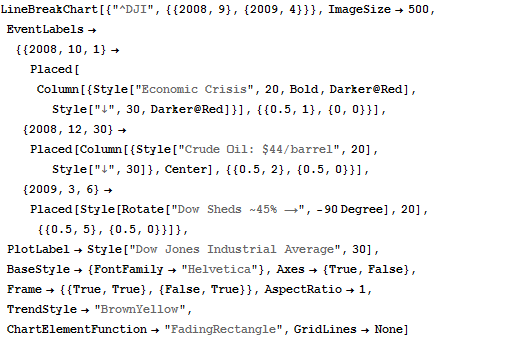
Placed를 사용한 레이블의 정렬
Placed
를 이용하여 도표에 날짜와 가격과 관련된 상태를 나타내는 레이블 표시를 어디에 둘 것인가를 조정할 수 있습니다.
In[1]:=
X
LineBreakChart[{"^DJI", {{2008, 9}, {2009, 4}}}, ImageSize -> 500, EventLabels -> {{2008, 10, 1} -> Placed[Column[{Style["Economic Crisis", 20, Bold, Darker@Red], Style["\[DownArrow]", 30, Darker@Red]}], {{0.5, 1}, {0, 0}}], {2008, 12, 30} -> Placed[Column[{Style["Crude Oil: $44/barrel", 20], Style["\[DownArrow]", 30]}, Center], {{0.5, 2}, {0.5, 0}}], {2009, 3, 6} -> Placed[Style[ Rotate["Dow Sheds ~45% \[LongRightArrow]", -90 Degree], 20], {{0.5, 5}, {0.5, 0}}]}, PlotLabel -> Style["Dow Jones Industrial Average", 30], BaseStyle -> {FontFamily -> "Helvetica"}, Axes -> {True, False}, Frame -> {{True, True}, {False, True}}, AspectRatio -> 1, TrendStyle -> "BrownYellow", ChartElementFunction -> "FadingRectangle", GridLines -> None]
Out[1]=