Graphics & Visualization
Create Nyquist Plots
Create Nyquist plots of functions or systems with custom gridlines.
| In[1]:= | 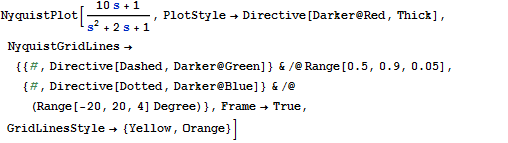 X |
| Out[1]= | 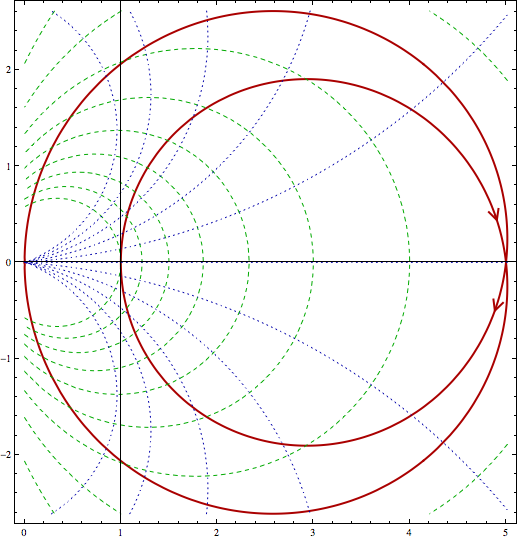 |
| New in Wolfram Mathematica 8: New and Improved Scientific and Information Visualization | ◄ previous | next ► |
| In[1]:= | X |
| Out[1]= | |