| New in Wolfram Mathematica 6: Automated Computational Aesthetics | ◄ previous | next ► |
Easily Create Master-Quality Visualizations
Mathematica 6 provides all the tools to make it easy to create the world's best visualizations.
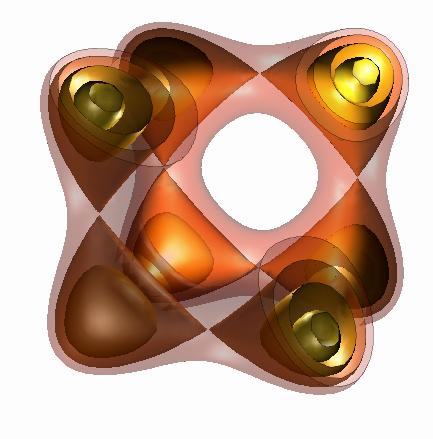
In[1]:= | ContourPlot3D[-x^2 + x^4 - y^2 + y^4 - z^2 + z^4 + 0.5, {x, -1.1,
1.1}, {y, -1.1, 1.1}, {z, -1.1, 1.1}, PlotPoints -> 32,
Mesh -> None, Contours -> {.1, 0, -.1, -.2}, Axes -> False,
Boxed -> False, BoundaryStyle -> Opacity[.2],
ContourStyle ->
Table[Directive[Specularity[White, 40], Opacity[i^1.2/4],
ColorData["SolarColors", i/4]], {i, 4}],
RegionFunction -> (#1 - #2 + #3 < .9 &),
Lighting -> {{"Point", White, {0, 0, 0}}, {"Directional",
GrayLevel[.4], {0, -2, 0}}}, ViewPoint -> {1, -4, 1}] |
Out[1]=  |  |

