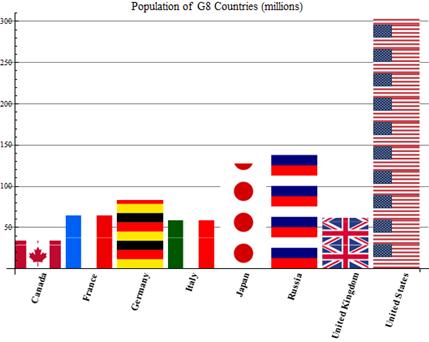
data = Table[

   Labeled[CountryData[c, "Population"]/10^6,

    Rotate[Style[CountryData[c, "Name"], Bold, FontSize -> 12],

     Pi/2.5]], {c, CountryData["G8"]}];
BarChart[data, ChartElements -> CountryData["G8", "Flag"],

 GridLines -> {None, Automatic},

 PlotLabel ->

  Style["Population of G8 Countries (millions)", "Title",

   FontSize -> 14]]