New in Wolfram Mathematica 7: Automated Charting Graphics  previous | next 
Use Color to Convey Information
Label your data with text and colors.
In[1]:=

Click for copyable input
data = Table[

   Last /@ WeatherData["KCMI", 

     "MeanTemperature", {{i, 1, 1}, {i, 12, 31}, "Month"}], {i, 2001, 

    2007, 1}];
In[2]:=

Click for copyable input
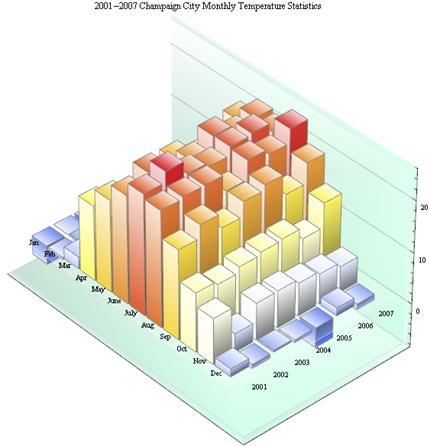
BarChart3D[data, ChartLayout -> "Grid", 

 ChartLabels -> {Range[2001, 2007], {"Jan", "Feb", "Mar", "Apr", 

    "May", "June", "July", "Aug", "Sep", "Oct", "Nov", "Dec"}}, 

 ColorFunction -> "TemperatureMap", 

 PlotLabel -> 

  "2001-2007 Champaign City Monthly Temperature Statistics", 

 Ticks -> {None, None, Automatic}, 

 ViewPoint -> {6.14459, -5.50656, 6.31836}]
Out[2]=