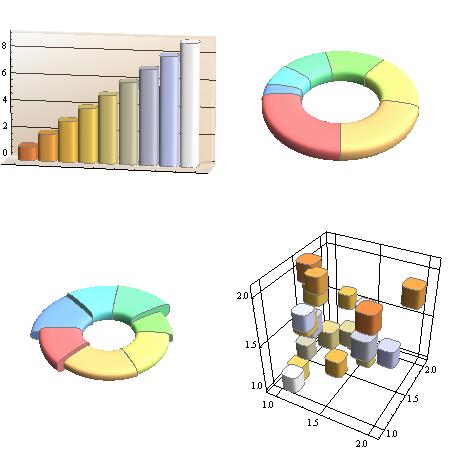
SeedRandom[312]; GraphicsGrid[{{BarChart3D[Range[9],

    ChartElementFunction -> "ProfileCube",

    ChartStyle -> "BeachColors"],

   PieChart3D[Range[7], SectorOrigin -> {Automatic, 1},

    ChartElementFunction -> "ProfileSector3D"]}, {SectorChart3D[

    RandomReal[{1, 2}, {7, 3}], SectorOrigin -> {Automatic, 1},

    ChartElementFunction -> "ProfileSector3D"],

   BubbleChart3D[RandomReal[{1, 2}, {20, 4}],

    ChartElementFunction -> "ProfileCube",

    ChartStyle -> "BeachColors"]}}, ImageSize -> {500, 500}]