New in Wolfram Mathematica 7: Enhanced Fourier Analysis  previous | next 
Compute a Discrete-Time Fourier Transform
Compute the DTFT of a sequence and visualize its spectrum with color indicating the phase.
In[1]:=

Click for copyable input
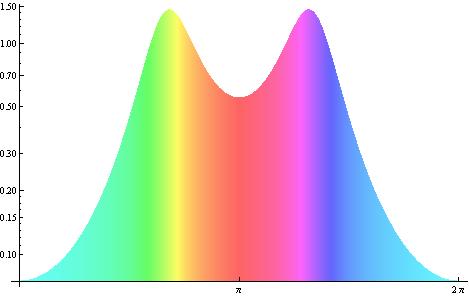
F = FourierSequenceTransform[Sin[n 2 Pi/3] (2/3)^n UnitStep[n], 

  n, \[Omega]]
Out[1]=


In[2]:=

Click for copyable input
LogPlot[Abs[F]^2, {\[Omega], 0, 2 \[Pi]}, 

  Ticks -> {{0, \[Pi], 2 \[Pi]}, Automatic}, 

  ColorFunction -> 

   Function[\[Omega], 

    Evaluate@Lighter[Hue[Arg[F]/(2 Pi) + 1/2], 0.4]], 

  ColorFunctionScaling -> False, Filling -> Axis] // Quiet
Out[2]=