New in Wolfram Mathematica 7: Vector & Field Visualization  previous | next 
Plot Field Vectors on a Regular Grid
Plot a vector field given by a function on a regular grid.
In[1]:=

Click for copyable input
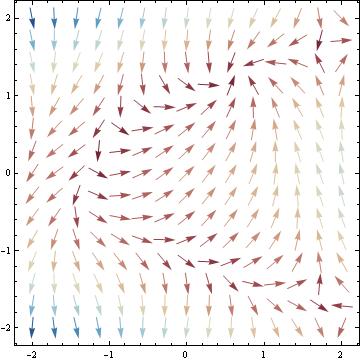
VectorPlot[{Cos[x^2 + y], 1 + x - y^2}, {x, -2, 2}, {y, -2, 2}, 

 VectorColorFunction -> "RedBlueTones", 

 VectorScale -> {0.05, Automatic, None}]
Out[1]=