| New in Wolfram Mathematica 6: Exploratory Data Analysis | ◄ previous | next ► |
Conveniently Compute Moving Averages
Mathematica 6 adds convenient computation of several forms of moving average.

In[1]:= |  Table[ListLinePlot[
MovingAverage[FinancialData["GE", "Jan. 1, 2000", "Value"], p],
Filling -> Axis], {p, {1, 10, 30, 100}}] |
Out[1]= | 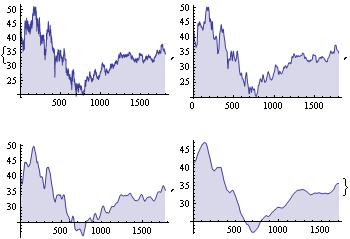 |