| New in Wolfram Mathematica 6: High-Impact Adaptive Visualization | ◄ previous | next ► |
Automatic Discontinuity Handling
Mathematica 6 uses advanced adaptive methods to automatically handle discontinuities in surfaces.

In[1]:= |  Plot3D[Im[ArcSin[(x + \[ImaginaryI] y)^5]], {x, -2, 2}, {y, -2, 2},
Mesh -> None, ExclusionsStyle -> {None, Black},
PlotStyle -> Directive[Orange, Specularity[White, 20]]] |
Out[1]= | 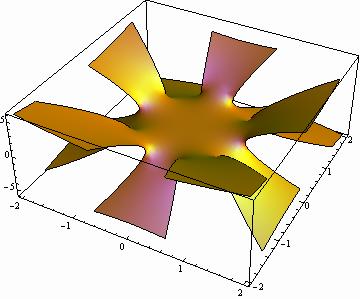 |