| New in Wolfram Mathematica 6: High-Impact Adaptive Visualization | ◄ previous | next ► |
Immediate Spherical Plotting
Mathematica 6 adds capabilities for immediately generating spherical height maps, as well as for general polar plots.

In[1]:= |  SphericalPlot3D[
1 + 1/10 Sin[5 \[Phi]] Sin[10 \[Theta]], {\[Theta],
0, \[Pi]}, {\[Phi], 0, 2 \[Pi]},
ColorFunction -> (ColorData["Rainbow"][#6] &), Mesh -> None,
PlotPoints -> 25, Axes -> False] |
Out[1]= | 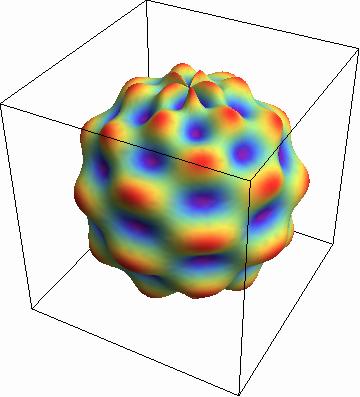 |