| New in Wolfram Mathematica 6: High-Impact Adaptive Visualization | ◄ previous | next ► |
Immediately Create Diagram-Quality Graphics
Mathematica 6 makes it easy to create graphics that immediately illustrate the important features of even the most complex functions.

In[1]:= |  Plot3D[Im[ Sec[(x + \[ImaginaryI] y)^3]], {x, -2, 2}, {y, -2, 2},
PlotPoints -> 40,
PlotStyle ->
Directive[ Opacity[0.9], Yellow, Specularity[White, 50]],
Mesh -> None, ClippingStyle -> Opacity[0.3]] |
Out[1]= | 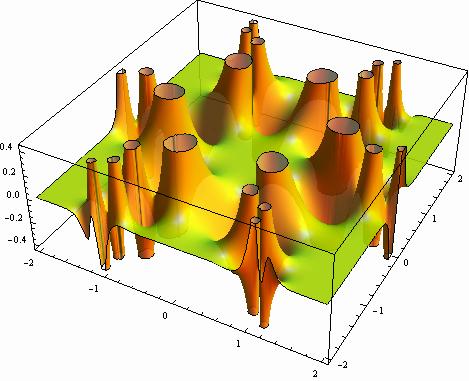 |