New in Wolfram Mathematica 7: Automated Charting Graphics  previous | next 
Annotate Data with Wrappers
In[1]:=

Click for copyable input
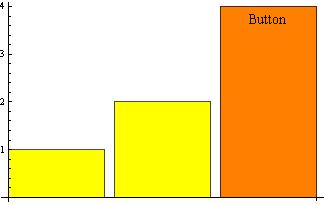
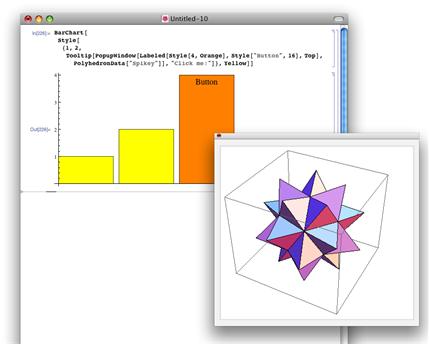
BarChart[{1, 2, 

  Tooltip[PopupWindow[

    Labeled[Style[4, Orange], Style["Button", 16], Top], 

    PolyhedronData["Spikey"]], "Click me!"]}, ChartStyle -> Yellow]
Out[1]=


Out[2]=