New in Wolfram Mathematica 7: Built-in Image Processing & Analysis  previous | next 
Immediately Integrate with Other Mathematica Capabilities
This breaks an images into pieces, then makes a chart of where the pieces lie in average color value.
In[1]:=

Click for copyable input
In[2]:=

Click for copyable input
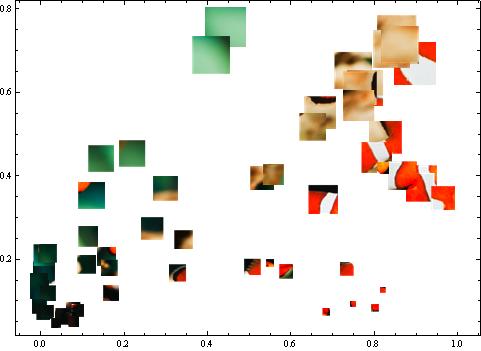
colormeans = Map[Mean[Mean[ImageData[#]]] &, images];
In[3]:=

Click for copyable input
BubbleChart[colormeans, ChartElements -> images, 

 AspectRatio -> Automatic]
Out[3]=