| New in Wolfram Mathematica 7: Comprehensive Spline Support | ◄ previous | next ► |
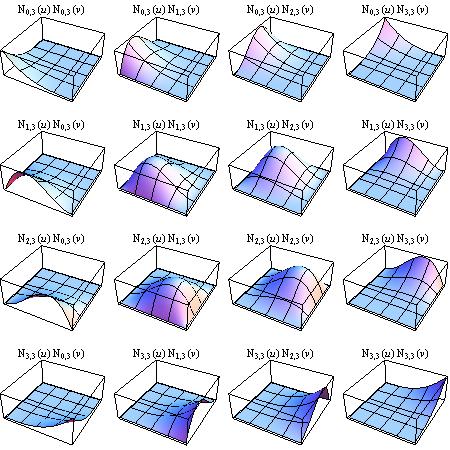
Tensor product B-spline functions can be easily built up using the multiplication of the basis functions.

 |
| New in Wolfram Mathematica 7: Comprehensive Spline Support | ◄ previous | next ► |
|