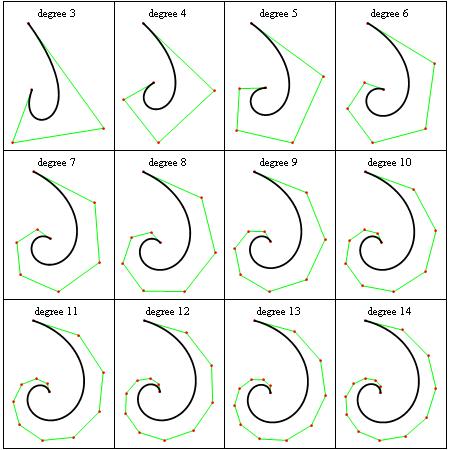
GraphicsGrid[

 Partition[

  Table[With[{pts = Table[i {Cos[8/n i], Sin[8/n i]}, {i, n}]},

    Graphics[{Green, Line[pts], Red, Point[pts], Thick, Black,

      BezierCurve[pts, SplineDegree -> (n - 1)]},

     PlotLabel -> Row[{"degree ", n - 1}]]], {n, 4, 16}], 4],

 Frame -> All, ImageSize -> {500, 500}]