| New in Wolfram Mathematica 7: Dynamic Astronomical Computation | ◄ previous | next ► |
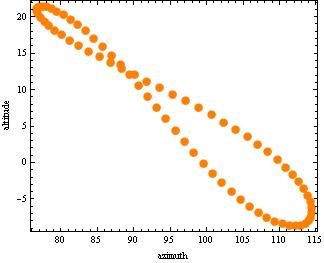
Determine the value of a number of properties that vary with observer location. Plotting the altitude and azimuth of the Sun for the same time throughout the year results in a pattern known as the analemma.

 |