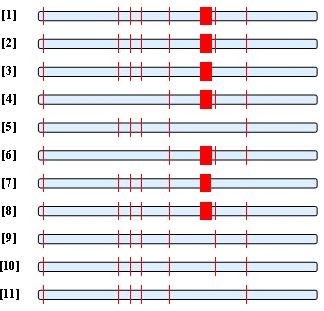
Module[

 {geneposn = GenomeData["BRCA1", "FullSequencePosition"],

  csposns = GenomeData["BRCA1", "CodingSequencePositions"],

  yscale = 1/30.

  },


 Graphics[

  MapIndexed[

   With[{exonposns =

       N@Rescale[# - geneposn[[1]], geneposn - geneposn[[1]] + 1],

      ycoord = 3*#2[[1]]*yscale},

     {EdgeForm[{Black, Thickness[0.004]}], LightBlue,

      Rectangle[{0, ycoord}, {1, ycoord + yscale},

       RoundingRadius -> 0.2/30],

      Black,

      Text[Style["[" <> ToString[12 - #2[[1]]] <> "]", Bold,

        13], {-.1, ycoord + yscale/2}],

      Red,

      EdgeForm[None],

      Rectangle[{#[[1]], ycoord - yscale/2}, {#[[2]],

          ycoord + 3 yscale/2}] & /@ exonposns

      }

     ] &,

   csposns

   ]

  ]

 ]