New in Wolfram Mathematica 7: Vector & Field Visualization  previous | next 
Plot Field Vectors at Random Positions
Plot a vector field by randomly selected positions.
In[1]:=

Click for copyable input
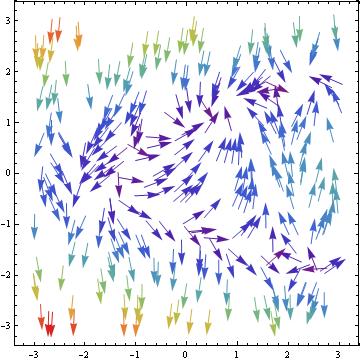
VectorPlot[{Cos[x^2 + y], 1 + x - y^2}, {x, -3, 3}, {y, -3, 3}, 

 VectorColorFunction -> "Rainbow", 

 VectorPoints -> RandomReal[{-3, 3}, {300, 2}], 

 VectorScale -> {Small, Automatic, None}]
Out[1]=