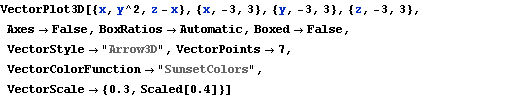
VectorPlot3D[{x, y^2, z - x}, {x, -3, 3}, {y, -3, 3}, {z, -3, 3},

 Axes -> False, BoxRatios -> Automatic, Boxed -> False,

 VectorStyle -> "Arrow3D", VectorPoints -> 7,

 VectorColorFunction -> "SunsetColors",

 VectorScale -> {0.3, Scaled[0.4]}]