New in Wolfram Mathematica 7: Vector & Field Visualization  previous | next 
Use Simulated Lighting for the Background Density
Use simulated lighting to better emphasize highly oscillating background densities.
In[1]:=

Click for copyable input
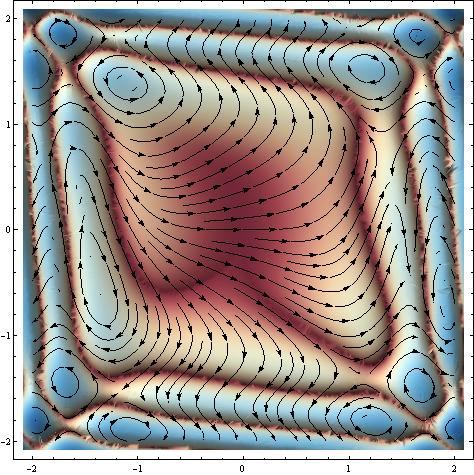
rot[x_, y_] = D[Sin[y + x^3], x] - D[Cos[x + y^3], y];
In[2]:=

Click for copyable input
StreamDensityPlot[{{Cos[x + y^3], Sin[y + x^3]}, 

  Log[Abs[rot[x, y]] + 1]}, {x, -2, 2}, {y, -2, 2}, 

 StreamPoints -> Fine, ColorFunction -> "RedBlueTones", 

 MaxRecursion -> 4, LightingAngle -> Automatic, StreamStyle -> Black]
Out[2]=