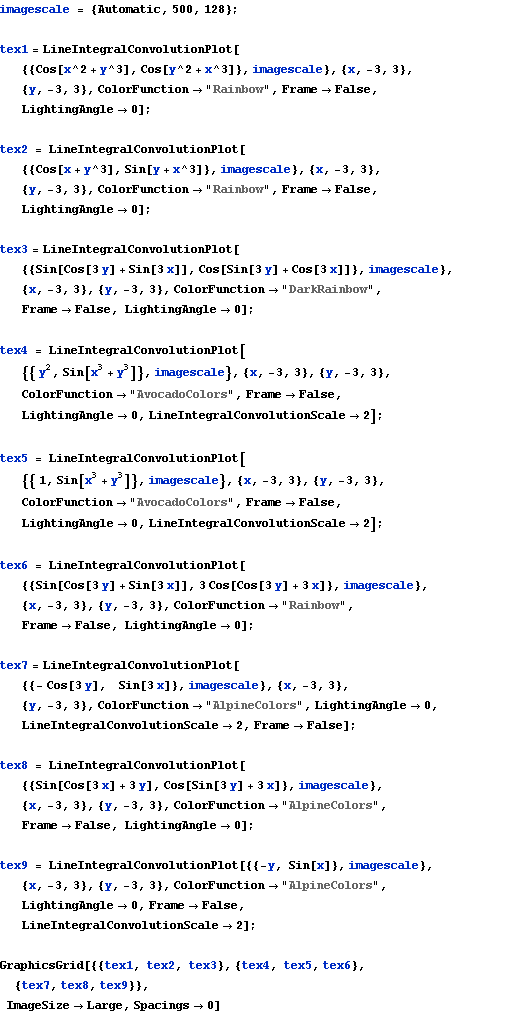
imagescale = {Automatic, 500, 128};

tex1 = LineIntegralConvolutionPlot[{{Cos[x^2 + y^3], Cos[y^2 + x^3]},

    imagescale}, {x, -3, 3}, {y, -3, 3}, ColorFunction -> "Rainbow",

   Frame -> False, LightingAngle -> 0];

tex2 = LineIntegralConvolutionPlot[{{Cos[x + y^3], Sin[y + x^3]},

    imagescale}, {x, -3, 3}, {y, -3, 3}, ColorFunction -> "Rainbow",

   Frame -> False, LightingAngle -> 0];

tex3 = LineIntegralConvolutionPlot[{{Sin[Cos[3 y] + Sin[3 x]],

     Cos[Sin[3 y] + Cos[3 x]]}, imagescale}, {x, -3, 3}, {y, -3, 3},

   ColorFunction -> "DarkRainbow", Frame -> False, LightingAngle -> 0];

tex4 = LineIntegralConvolutionPlot[{{ y^2, Sin[x^3 + y^3]},

    imagescale}, {x, -3, 3}, {y, -3, 3},

   ColorFunction -> "AvocadoColors", Frame -> False,

   LightingAngle -> 0, LineIntegralConvolutionScale -> 2];

tex5 = LineIntegralConvolutionPlot[{{ 1, Sin[x^3 + y^3]},

    imagescale}, {x, -3, 3}, {y, -3, 3},

   ColorFunction -> "AvocadoColors", Frame -> False,

   LightingAngle -> 0, LineIntegralConvolutionScale -> 2];

tex6 = LineIntegralConvolutionPlot[{{Sin[Cos[3 y] + Sin[3 x]],

     3 Cos[Cos[3 y] + 3 x]}, imagescale}, {x, -3, 3}, {y, -3, 3},

   ColorFunction -> "Rainbow", Frame -> False, LightingAngle -> 0];

tex7 = LineIntegralConvolutionPlot[{{- Cos[3 y],   Sin[3 x]},

    imagescale}, {x, -3, 3}, {y, -3, 3},

   ColorFunction -> "AlpineColors", LightingAngle -> 0,

   LineIntegralConvolutionScale -> 2, Frame -> False];

tex8 = LineIntegralConvolutionPlot[{{Sin[Cos[3 x] + 3 y],

     Cos[Sin[3 y] + 3 x]}, imagescale}, {x, -3, 3}, {y, -3, 3},

   ColorFunction -> "AlpineColors", Frame -> False,

   LightingAngle -> 0];

tex9 = LineIntegralConvolutionPlot[{{-y, Sin[x]}, imagescale}, {x, -3,

     3}, {y, -3, 3}, ColorFunction -> "AlpineColors",

   LightingAngle -> 0, Frame -> False,

   LineIntegralConvolutionScale -> 2];

GraphicsGrid[{{tex1, tex2, tex3}, {tex4, tex5, tex6}, {tex7, tex8,

   tex9}},

 ImageSize -> Large, Spacings -> 0]