Graphics

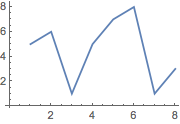
The Wolfram Language makes it easy to take data of any kind and visualize it:
Notes for Java programmers:
Graphics are an integrated part of the Wolfram Language. To create graphics in Java, you can either write custom code in a GUI library such as Swing or AWT, or use a third-party library such as JFreeChart.
Notes for Java programmers:
Wolfram Language graphics are displayed inline in the notebook, rather than requiring a separate GUI to display the results.
Notes for Python programmers:
Graphics are deeply integrated into the Wolfram Language, display directly in Wolfram Notebooks and can also be used as input. Python allows only textual input, and to display graphics requires using a third-party notebook library such as Jupyter and a graphics library such as matplotlib.
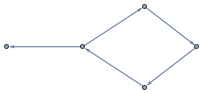
Graphics are represented as symbolic expressions, using either "directives" or "styles":


QUICK REFERENCE: Graphics and Visualization
Visualization functions take many options.
PlotTheme gives a way to choose an overall "theme".