Wolfram
Mathematica
8의 신기능: 새롭게 향상된 과학 및 정보 시각화 기능
◄
이전
|
다음
►
그래픽 및 시각화
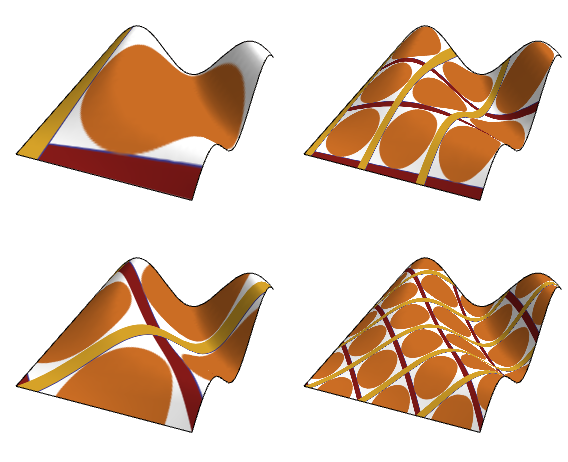
텍스처의 스케일 및 위치 적용 제어
텍스처를 어떻게 곡면에 적용할지 여부를 제어하기 위해서
TextureCoordinateFunction
및
TextureCoordinateScaling
을 사용합니다.
In[1]:=
X
t = \!\(\* GraphicsBox[{ {Hue[0.67, 0.6, 0.6], EdgeForm[{Hue[0.6699931334401464, 0.6, 0.6], Opacity[1.], AbsoluteThickness[1]}], FaceForm[RGBColor[ 0.521431, 0.101228, 0.0935225]], RectangleBox[{-0.006944444444444392, 0.0986111111111112}, \ {1.3541666666666665`, -0.012499999999999734`}]}, {Hue[0.67, 0.6, 0.6], EdgeForm[{Hue[0.6699931334401464, 0.6, 0.6], Opacity[1.], AbsoluteThickness[1]}], FaceForm[RGBColor[ 0.837903, 0.633356, 0.15639]], RectangleBox[{-0.01805572222222237, 1.0125000000000002`}, \ {0.13749983333333324`, -0.05972222222222227}]}, {Hue[0.67, 0.6, 0.6], EdgeForm[{RGBColor[0.79733, 0.420493, 0.141039], Opacity[1.], AbsoluteThickness[1]}], FaceForm[RGBColor[ 0.798001, 0.427634, 0.141436]], DiskBox[{0.5860026561794192, 0.5471139339571973}, \ {0.43977055917901375`, 0.43977055917901364`}]}}, AspectRatio->0.9728997289972899, ContentSelectable->True, ImagePadding->{{0., 0.}, {0., 0.}}, ImageSize->{119., 115.}, PlotRange->{{0., 1.040168873150106}, {0., 1.}}, PlotRangePadding->None]\);
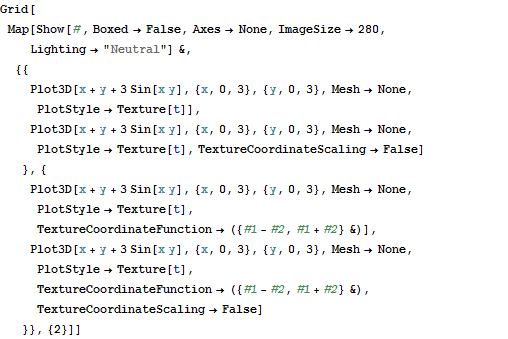
In[2]:=
X
Grid[Map[Show[#, Boxed -> False, Axes -> None, ImageSize -> 280, Lighting -> "Neutral"] &, {{ Plot3D[x + y + 3 Sin[x y], {x, 0, 3}, {y, 0, 3}, Mesh -> None, PlotStyle -> Texture[t]], Plot3D[x + y + 3 Sin[x y], {x, 0, 3}, {y, 0, 3}, Mesh -> None, PlotStyle -> Texture[t], TextureCoordinateScaling -> False] }, { Plot3D[x + y + 3 Sin[x y], {x, 0, 3}, {y, 0, 3}, Mesh -> None, PlotStyle -> Texture[t], TextureCoordinateFunction -> ({#1 - #2, #1 + #2} &)], Plot3D[x + y + 3 Sin[x y], {x, 0, 3}, {y, 0, 3}, Mesh -> None, PlotStyle -> Texture[t], TextureCoordinateFunction -> ({#1 - #2, #1 + #2} &), TextureCoordinateScaling -> False] }}, {2}]]
Out[2]=