Wolfram
Mathematica
8의 신기능: 매개 변수 추정 및 검정
◄
이전
|
다음
►
핵심 알고리즘
풍속의 두가지 모델 비교
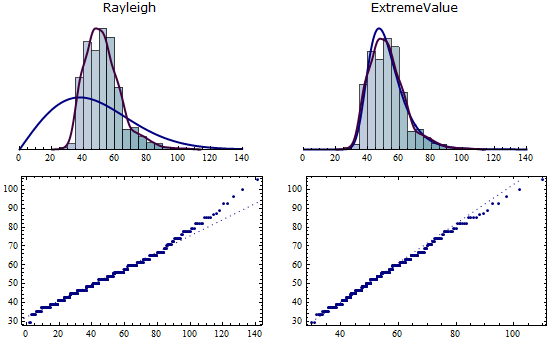
풍속 데이터를 Rayleigh 모델 및 극값 모델에 맞게 적합하고 데이터를 커널 밀도 추정과 시각적으로 비교하여 실험한 것과 적합한 것의 분위수를 질적으로 비교합니다.
In[1]:=
X
maxWinds = WeatherData["Boston", "MaxWindSpeed", {{1950, 1, 1}, {2009, 12, 31}, "Month"}][[ All, -1]];
In[2]:=
X
rdist = EstimatedDistribution[maxWinds, RayleighDistribution[\[Theta]]]; evdist = EstimatedDistribution[maxWinds, ExtremeValueDistribution[a, b]];
In[3]:=
X
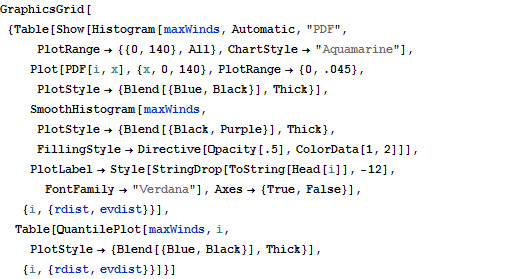
GraphicsGrid[{Table[ Show[Histogram[maxWinds, Automatic, "PDF", PlotRange -> {{0, 140}, All}, ChartStyle -> "Aquamarine"], Plot[PDF[i, x], {x, 0, 140}, PlotRange -> {0, .045}, PlotStyle -> {Blend[{Blue, Black}], Thick}], SmoothHistogram[maxWinds, PlotStyle -> {Blend[{Black, Purple}], Thick}, FillingStyle -> Directive[Opacity[.5], ColorData[1, 2]]], PlotLabel -> Style[StringDrop[ToString[Head[i]], -12], FontFamily -> "Verdana"], Axes -> {True, False}], {i, {rdist, evdist}}], Table[QuantilePlot[maxWinds, i, PlotStyle -> {Blend[{Blue, Black}], Thick}], {i, {rdist, evdist}}]}]
Out[3]=