Wolfram
Mathematica
8의 신기능: 매개 변수 추정 및 검정
◄
이전
|
다음
►
핵심 알고리즘
지진 규모의 혼합 모델 개발
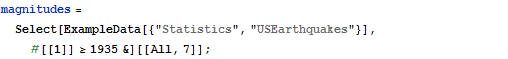
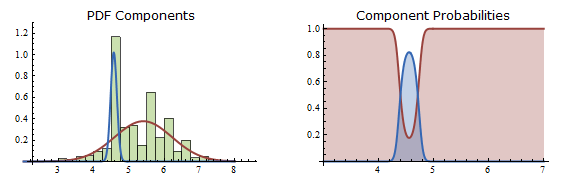
과거 지진 진도에 대한 혼합 모델의 요소 데이터를 플롯하여 특정 규모 모델의 각 성분에서 파생되는 확률을 시각화합니다.
In[1]:=
X
magnitudes = Select[ExampleData[{"Statistics", "USEarthquakes"}], #[[1]] >= 1935 &][[All, 7]];
In[2]:=
X
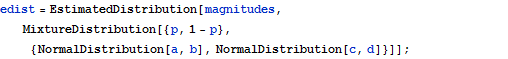
edist = EstimatedDistribution[magnitudes, MixtureDistribution[{p, 1 - p}, {NormalDistribution[a, b], NormalDistribution[c, d]}]];
In[3]:=
X
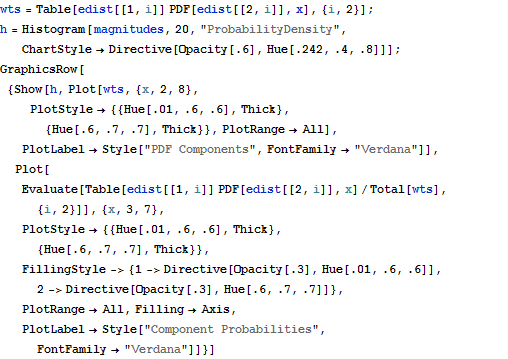
wts = Table[edist[[1, i]] PDF[edist[[2, i]], x], {i, 2}]; h = Histogram[magnitudes, 20, "ProbabilityDensity", ChartStyle -> Directive[Opacity[.6], Hue[.242, .4, .8]]]; GraphicsRow[{Show[h, Plot[wts, {x, 2, 8}, PlotStyle -> {{Hue[.01, .6, .6], Thick}, {Hue[.6, .7, .7], Thick}}, PlotRange -> All], PlotLabel -> Style["PDF Components", FontFamily -> "Verdana"]], Plot[Evaluate[ Table[edist[[1, i]] PDF[edist[[2, i]], x]/Total[wts], {i, 2}]], {x, 3, 7}, PlotStyle -> {{Hue[.01, .6, .6], Thick}, {Hue[.6, .7, .7], Thick}}, FillingStyle -> {1 -> Directive[Opacity[.3], Hue[.01, .6, .6]], 2 -> Directive[Opacity[.3], Hue[.6, .7, .7]]}, PlotRange -> All, Filling -> Axis, PlotLabel -> Style["Component Probabilities", FontFamily -> "Verdana"]]}]
Out[3]=