Wolfram
Mathematica
8의 신기능: 매개 변수 추정 및 검정
◄
이전
|
다음
►
핵심 알고리즘
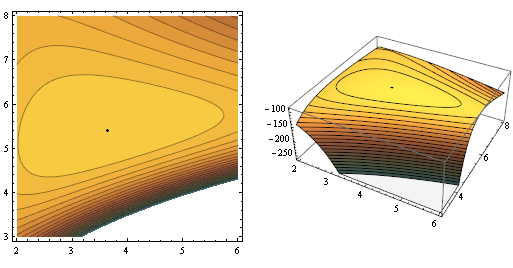
최적 모수값의 가시화
최대 우도를 이용하여 데이터를 Weibull 분포에 맞게 로그 우도 등고선 및 3D 그래프의 최적 점을 시각화 합니다.
In[1]:=
X
data = BlockRandom[SeedRandom[100]; RandomVariate[WeibullDistribution[4, 5], 50]];
In[2]:=
X
params = FindDistributionParameters[data, WeibullDistribution[\[Alpha], \[Beta]]];
In[3]:=
X
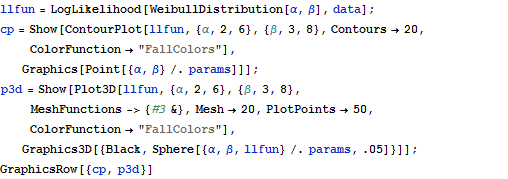
llfun = LogLikelihood[WeibullDistribution[\[Alpha], \[Beta]], data]; cp = Show[ ContourPlot[llfun, {\[Alpha], 2, 6}, {\[Beta], 3, 8}, Contours -> 20, ColorFunction -> "FallColors"], Graphics[Point[{\[Alpha], \[Beta]} /. params]]]; p3d = Show[ Plot3D[llfun, {\[Alpha], 2, 6}, {\[Beta], 3, 8}, MeshFunctions -> {#3 &}, Mesh -> 20, PlotPoints -> 50, ColorFunction -> "FallColors"], Graphics3D[{Black, Sphere[{\[Alpha], \[Beta], llfun} /. params, .05]}]]; GraphicsRow[{cp, p3d}]
Out[3]=