핵심 알고리즘
영어는 단어의 임의의 집합이 아닙니다
영어 단어 길이는 첫번째 그림과 같이 BinomialDistribution에 따릅니다. 임의의 길이의 단어 모임은 두 번째 그래픽과 같이 WaringYuleDistribution로 모델링할 수있습니다.
| In[1]:= | X |
| In[2]:= | 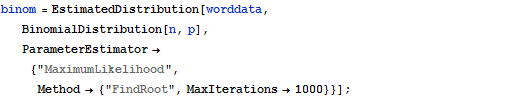 X |
| In[3]:= | 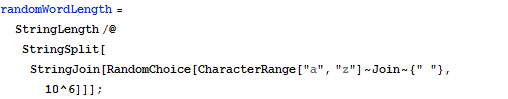 X |
| In[4]:= | X |
| In[5]:= | 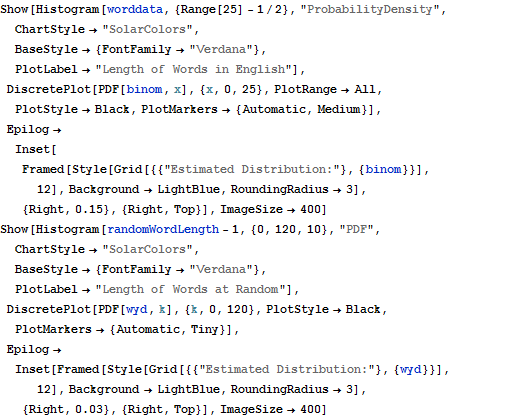 X |
| Out[5]= | 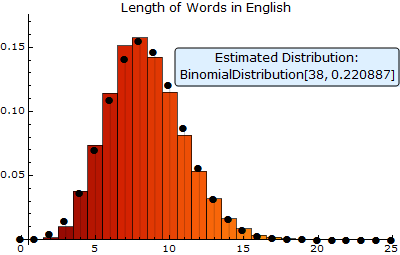 |
| Out[5]= |  |
| Wolfram Mathematica 8의 신기능: 매개 변수 확률 분포 | ◄ 이전 | 다음 ► |
| In[1]:= | X |
| In[2]:= | X |
| In[3]:= | X |
| In[4]:= | X |
| In[5]:= | X |
| Out[5]= | |
| Out[5]= | |