핵심 알고리즘
로지스틱 분포를 이용한 작은 변화 시뮬레이션
LogisticDistribution은 직전일의 주식 종가로부터 소량의 가격 변동에 대해 매우 높은 적합도를 제공합니다. EstimatedDistribution를 사용하여 2000년 1 월 1 일부터 2009년 1 월 1 일까지의 S&P 500 지수의 매일 매일의 작은 가격 변동에 대한 로지스틱 분포로 최적의 적합을 찾아줍니다. 그리고 이 분포를 사용하여 시뮬레이션을 실행합니다.
| In[1]:= | X |
| In[2]:= | X |
| In[3]:= | 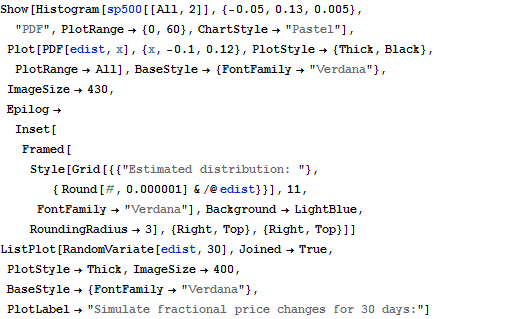 X |
| Out[3]= | 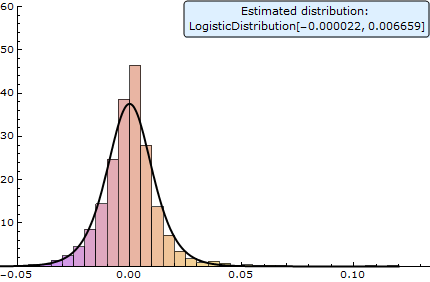 |
| Out[3]= | 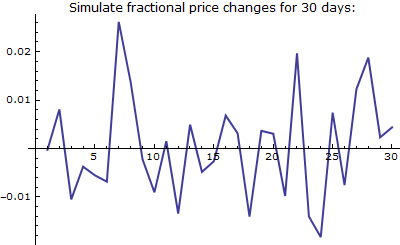 |