Wolfram
Mathematica
8의 신기능: 매개 변수 확률 분포
◄
이전
|
다음
►
핵심 알고리즘
안정 분포를 사용한 주가 모델링
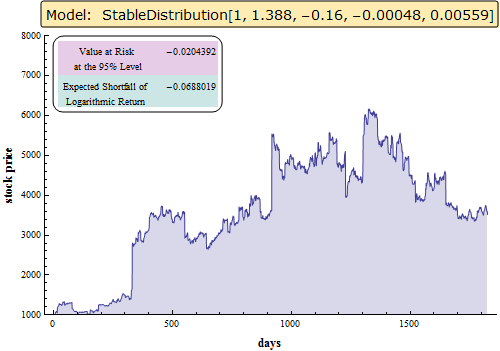
주식 시장의 매일 로그 수익률이 안정 분포를 따른다고 가정하고 5 년간의 주가를 실험하고 시각화해 본 것입니다.
In[1]:=
X
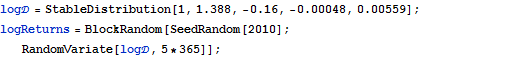
log\[ScriptCapitalD] = StableDistribution[1, 1.388, -0.16, -0.00048, 0.00559]; logReturns = BlockRandom[SeedRandom[2010]; RandomVariate[log\[ScriptCapitalD], 5*365]];
In[2]:=
X
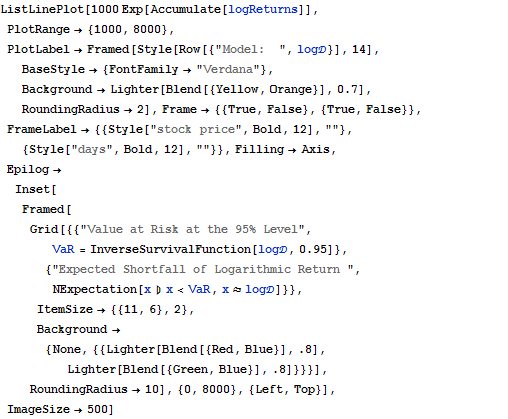
ListLinePlot[1000 Exp[Accumulate[logReturns]], PlotRange -> {1000, 8000}, PlotLabel -> Framed[Style[Row[{"Model: ", log\[ScriptCapitalD]}], 14], BaseStyle -> {FontFamily -> "Verdana"}, Background -> Lighter[Blend[{Yellow, Orange}], 0.7], RoundingRadius -> 2], Frame -> {{True, False}, {True, False}}, FrameLabel -> {{Style["stock price", Bold, 12], ""}, {Style["days", Bold, 12], ""}}, Filling -> Axis, Epilog -> Inset[Framed[ Grid[{{"Value at Risk at the 95% Level", VaR = InverseSurvivalFunction[log\[ScriptCapitalD], 0.95]}, {"Expected Shortfall of Logarithmic Return ", NExpectation[x \[Conditioned] x < VaR, x \[Distributed] log\[ScriptCapitalD]]}}, ItemSize -> {{11, 6}, 2}, Background -> {None, {{Lighter[Blend[{Red, Blue}], .8], Lighter[Blend[{Green, Blue}], .8]}}}], RoundingRadius -> 10], {0, 8000}, {Left, Top}], ImageSize -> 500]
Out[2]=