Wolfram
Mathematica
8의 신기능: 확률과 통계의 해법 및 특성
◄
이전
|
다음
►
핵심 알고리즘
Glivenko-Cantelli 정리
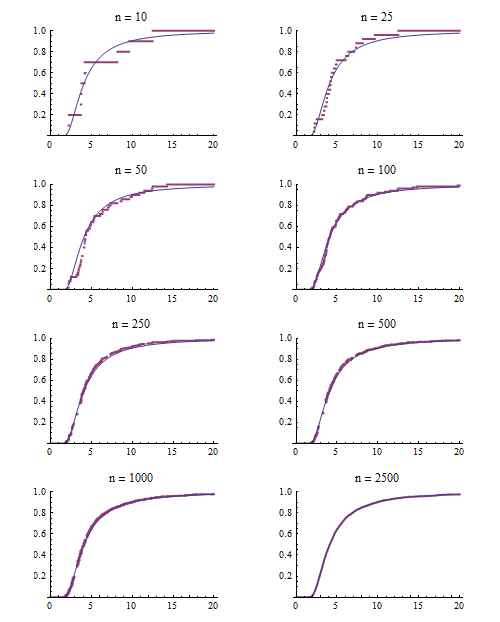
경험 분포와 이론 분포를 비교하여, 표본수가 증가함에 따라 경험 분포가 이론 분포에 접근하는 것을 보여줍니다.
In[1]:=
X
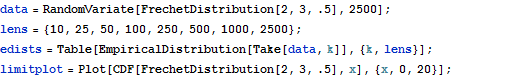
data = RandomVariate[FrechetDistribution[2, 3, .5], 2500]; lens = {10, 25, 50, 100, 250, 500, 1000, 2500}; edists = Table[EmpiricalDistribution[Take[data, k]], {k, lens}]; limitplot = Plot[CDF[FrechetDistribution[2, 3, .5], x], {x, 0, 20}];
In[2]:=
X
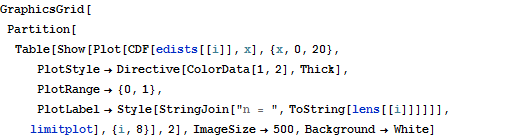
GraphicsGrid[ Partition[ Table[Show[ Plot[CDF[edists[[i]], x], {x, 0, 20}, PlotStyle -> Directive[ColorData[1, 2], Thick], PlotRange -> {0, 1}, PlotLabel -> Style[StringJoin["n = ", ToString[lens[[i]]]]]], limitplot], {i, 8}], 2], ImageSize -> 500, Background -> White]
Out[2]=