Graphics & Visualization
Combine Histograms with Data
Show a 3D smooth histogram with an inset scatter plot of the actual data.
| In[1]:= | X |
| In[2]:= | 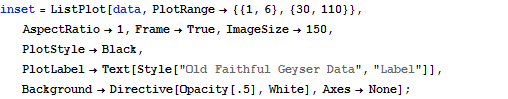 X |
| In[3]:= |  X |
| Out[3]= | 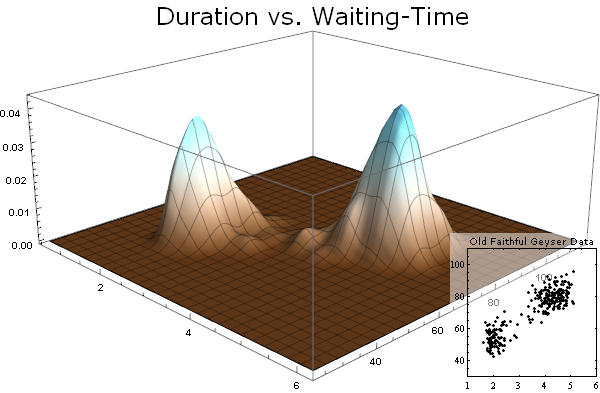 |
| New in Wolfram Mathematica 8: Statistical Visualization | ◄ previous | next ► |
| In[1]:= | X |
| In[2]:= | X |
| In[3]:= | X |
| Out[3]= | |