Wolfram
Mathematica
8의 신기능: 통계의 시각화
◄
이전
|
다음
►
그래픽 및 시각화
Q-Q 그래프로 데이터와 분포도 비교
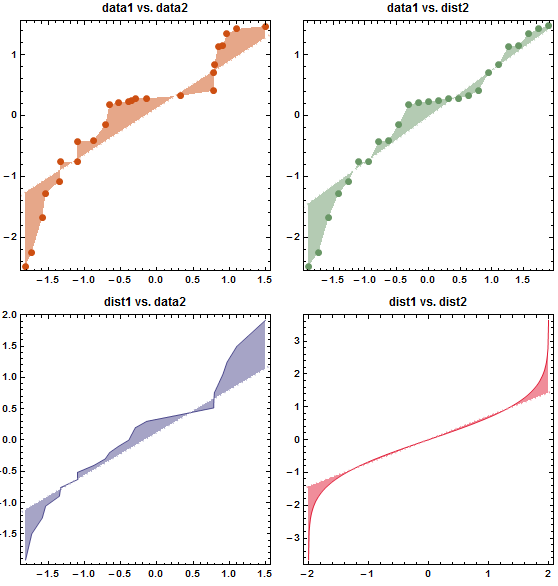
분위수-분위수 그래프를 사용하여 데이터와 분포, 데이터와 데이터, 분포와 데이터 그리고 분포와 분포를 비교할 수 있습니다.
In[1]:=
X
data1 = RandomReal[NormalDistribution[], 25]; data2 = RandomReal[UniformDistribution[{-2, 2}], 25]; dist1 = NormalDistribution[]; dist2 = UniformDistribution[{-2, 2}];
In[2]:=
X
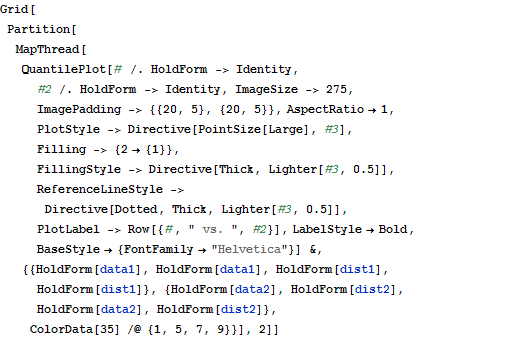
Grid[Partition[ MapThread[ QuantilePlot[# /. HoldForm -> Identity, #2 /. HoldForm -> Identity, ImageSize -> 275, ImagePadding -> {{20, 5}, {20, 5}}, AspectRatio -> 1, PlotStyle -> Directive[PointSize[Large], #3], Filling -> {2 -> {1}}, FillingStyle -> Directive[Thick, Lighter[#3, 0.5]], ReferenceLineStyle -> Directive[Dotted, Thick, Lighter[#3, 0.5]], PlotLabel -> Row[{#, " vs. ", #2}], LabelStyle -> Bold, BaseStyle -> {FontFamily -> "Helvetica"}] &, {{HoldForm[data1], HoldForm[data1], HoldForm[dist1], HoldForm[dist1]}, {HoldForm[data2], HoldForm[dist2], HoldForm[data2], HoldForm[dist2]}, ColorData[35] /@ {1, 5, 7, 9}}], 2]]
Out[2]=