Wolfram
Mathematica
8의 신기능: 통계의 시각화
◄
이전
|
다음
►
그래픽 및 시각화
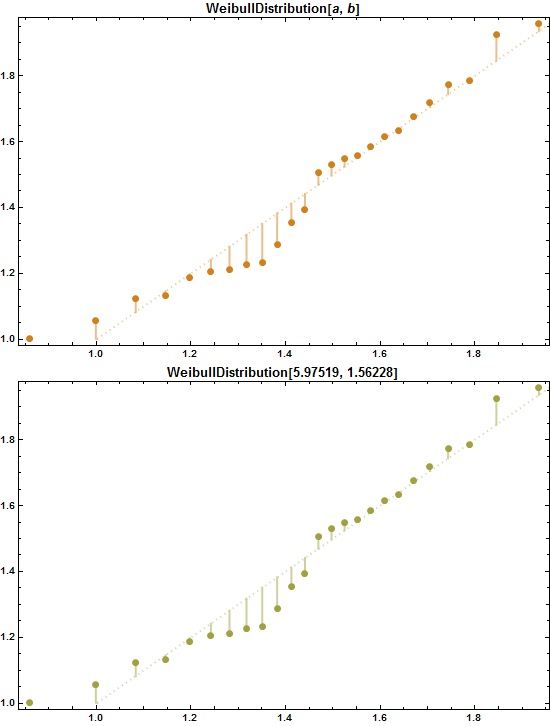
추정 분포 변수의 Q-Q 그래프 그리기
데이터와 지정된 유형의 최적 분포도와 비교하기 위한 분위수-분위수 그래프를 그려봅니다.
In[1]:=
X
data = RandomReal[UniformDistribution[{1, 2}], 25];
In[2]:=
X
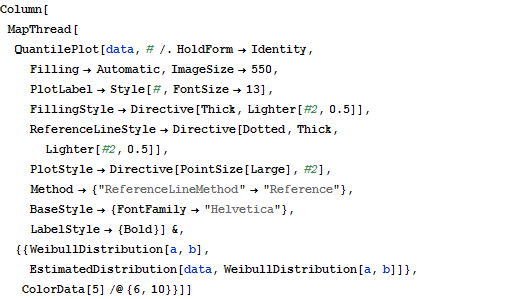
Column[MapThread[ QuantilePlot[data, # /. HoldForm -> Identity, Filling -> Automatic, ImageSize -> 550, PlotLabel -> Style[#, FontSize -> 13], FillingStyle -> Directive[Thick, Lighter[#2, 0.5]], ReferenceLineStyle -> Directive[Dotted, Thick, Lighter[#2, 0.5]], PlotStyle -> Directive[PointSize[Large], #2], Method -> {"ReferenceLineMethod" -> "Reference"}, BaseStyle -> {FontFamily -> "Helvetica"}, LabelStyle -> {Bold}] &, {{WeibullDistribution[a, b], EstimatedDistribution[data, WeibullDistribution[a, b]]}, ColorData[5] /@ {6, 10}}]]
Out[2]=