Gráficos y visualización
Histogramas en pares creados para comparar datos
Use histogramas en pares para comparar dos grupos de datos uno al lado del otro.
| In[1]:= | 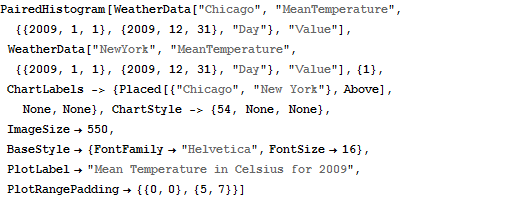 X |
| Out[1]= | 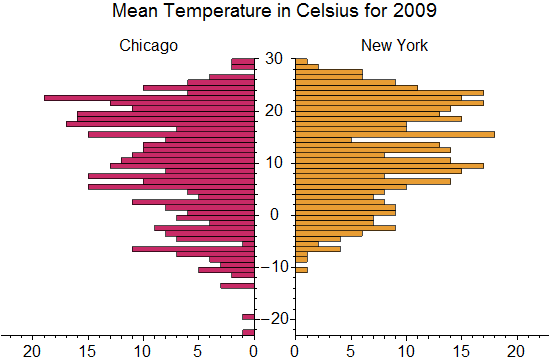 |
| New in Wolfram Mathematica 8: Visualización estadística | ◄ previous | next ► |
| In[1]:= | X |
| Out[1]= | |